

Extract Aspect Values to Points
Summary
Copies a point feature class and adds a field holding the aspect at each point, read from an aspect raster. It does what Esri's Extract Values to Points does, but built for aspect: the optional interpolation is a weighted mean direction, a circular calculation that never averages 359° and 1° into 180°; flat cells, stored as −1, are handled as cells with no direction rather than as a value; D-infinity flow-direction rasters are accepted; and no Spatial Analyst extension is needed.
Why a special tool for aspect
Aspect is the compass direction a slope faces, from 0° at north clockwise through 90° east, 180° south and 270° west back to north at 360°. It is a circle, not a number line: 359° and 1° are two degrees apart, not 358. Esri's Extract Values to Points is a fine tool for elevation, slope, or any other ordinary raster, but with interpolation switched on it averages the neighboring cell values as plain numbers. A point lying between a cell facing 359° and a cell facing 1° comes out at about 180°, due south, when both cells face almost due north. Jenness (2012) gives that example as the commonest mistake made with directional data.
This tool interpolates the way circular statistics do. Each of the four cell centers around the point is treated as an arrow of length one pointing in its aspect direction, with an east-west component sin θ and a north-south component cos θ. The four arrows are weighted by the standard bilinear weights, which depend on how close the point lies to each cell center, and added. The direction of the summed arrow is the interpolated aspect:
where θi is the aspect of each of the four surrounding cell centers, wi its bilinear weight, and atan2 the two-argument arctangent that returns the full 0° to 360° circle. For the point between 359° and 1°, the two arrows both point nearly north, their sum points north, and the answer is about 0°. A cell facing due north and one facing due east, weighted equally, give northeast, 45°, which is what a person standing between the two slopes would expect.
Flat cells have no direction, so a flat neighbor contributes no arrow: it is left out and the weights of the remaining directional neighbors are renormalized to sum to one. A NoData neighbor is left out the same way. If every neighbor of a point is flat, the point gets −1, the flat value; if every neighbor is NoData, the point gets no value. A point also gets −1 when its neighbors' arrows cancel exactly, two facing north and two facing south with equal weights, say: the summed arrow then has no length and no bearing, so the point has no defined direction, and the run report counts it with the flat points. Directions that come out at exactly 360° are written as 0°, so the field never holds both names for north.
Two ways to extract
The Interpolate checkbox chooses between two readings of the raster, and the default matches Esri's default:
- Unchecked: each point receives the value of the cell it falls in, exactly as stored. A point on a flat cell receives −1. This is the right choice when the raster's cells are small compared with the precision of the point locations, or when the stored values themselves are what you need. For a compass aspect raster, the values are exactly the ones Esri's Extract Values to Points writes with its default setting; nothing is converted, not even 360. The differences lie around the values: no Spatial Analyst license is needed, the field is named Aspect (or whatever you choose) rather than RASTERVALU, the field's metadata records what the numbers mean, and the run report counts the points that fell on flat cells. The one case where the values themselves differ is a D-infinity raster read with the Mathematical convention, whose angles are converted to compass degrees (see below).
- Checked: each point receives the weighted mean direction of the four surrounding cell centers, as above. This smooths out the cell edges and gives a point near the boundary of two cells a direction between them rather than the direction of whichever cell happens to contain it.
What the output holds
The output is a new point feature class: a copy of the input points, with all their attributes, plus one new DOUBLE field. If the input layer has an active selection, only the selected points are copied. The field is named Aspect unless you choose another name; a name that is not valid for the output workspace, or is already taken, is adjusted, and the run messages report the name actually used. Its values are compass degrees, 0 to 360, in every case, with −1 for a flat cell. A point that falls on NoData or outside the raster gets NULL in a geodatabase output; a shapefile cannot store NULL in a number field, so it gets −9999 there.
The field's own metadata records the units, the −1 and NULL or −9999 conventions, whether the value was interpolated, and the source raster, so the meaning of the numbers travels with the data. Esri's option to append all of the raster's attributes is deliberately not offered: an aspect raster has no attribute table worth appending, and the one field says everything.
The tool warns if the raster's values fall outside the range −1 to 360, which nearly always means the raster is not aspect at all, such as a slope or elevation raster picked by mistake. The run still completes.
Coordinate systems
The points are read in the raster's coordinate system. Point coordinates can be reprojected exactly, while projecting a raster resamples every cell and damages the values, so the raster is never projected, and the points and raster may be in different coordinate systems without harm. When the two are on different datums, such as NAD27 points on a NAD83 raster, the points are moved with a datum transformation as well, and the run messages name the transformation used; without one, points can land 100 m or more from their true cells. The raster is read only over the extent of the points, with a margin of cells around it, so a regional raster with a small cluster of points is handled quickly. Projected and geographic rasters both work, since a point's containing cell and its four neighboring cell centers are found the same way in either. See Projecting Rasters for why the raster is left alone.
Direction conventions and flow-direction rasters
The Input aspect convention drop-down says how the raster measures direction. Compass (0 = north, clockwise), the default, is ordinary aspect. Mathematical (0 = east, counter-clockwise; e.g. D-infinity) is the convention of D-infinity flow-direction rasters, whose values are the direction of steepest descent and so are essentially aspect measured the other way round. With the mathematical convention chosen, each extracted direction is converted to compass degrees before it is written, so the field reads the same as one extracted from an ordinary aspect raster.
The tool sets the drop-down for you when it can, by reading the geoprocessing history stored in the raster's metadata: a raster made by Esri's Flow Direction tool with the D-infinity option is recognized and the drop-down is set to Mathematical; when the history says nothing, it stays at Compass. A raster from Flow Direction's D8 option is a different matter. Its values, 1, 2, 4, 8, 16, 32, 64 and 128, are codes for eight categories, not angles, and the tool warns that they are not valid input.
A tour of the dialog
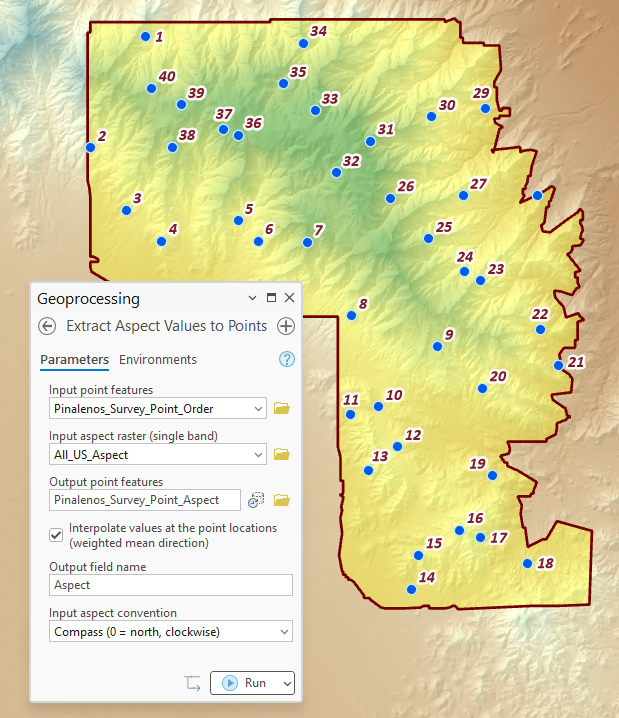
The dialog asks for the points, the aspect raster, and an output name, which is suggested from the input. Below those are the Interpolate checkbox, the output field name, and the convention drop-down, which fills itself in from the raster's history when it can. The checkbox and field name are remembered from run to run.
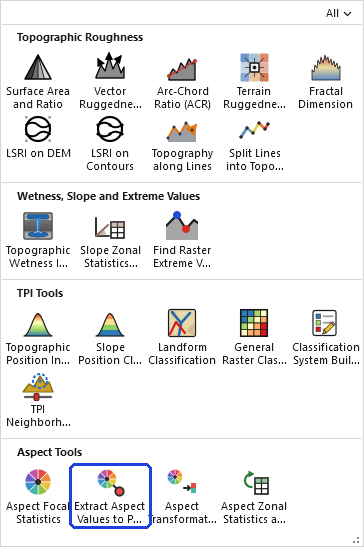
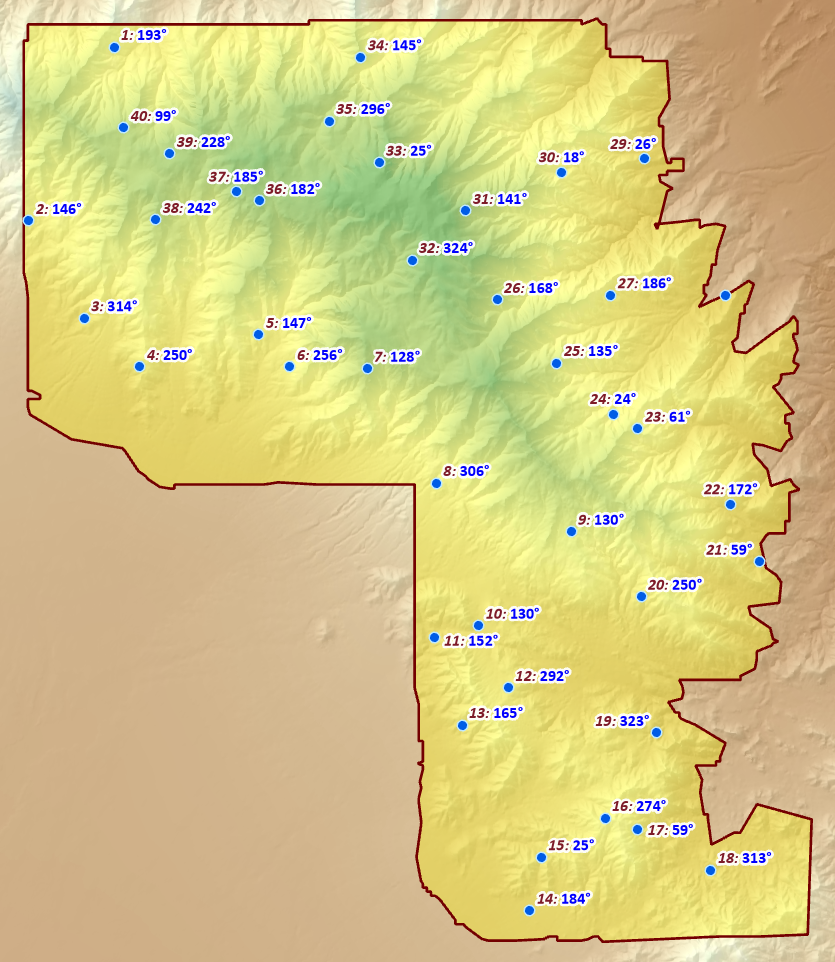
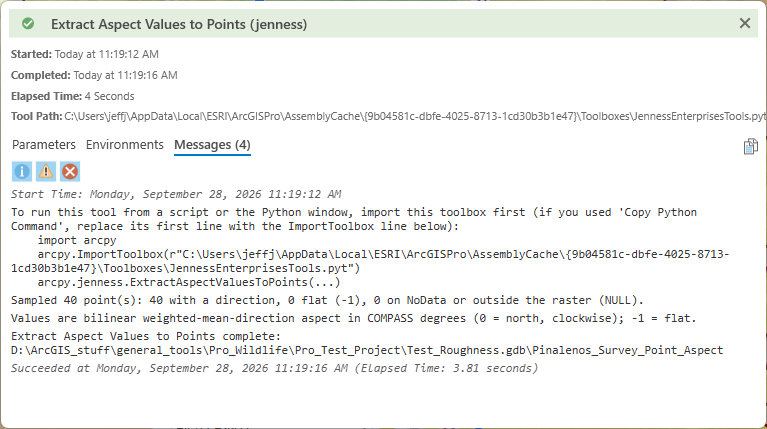
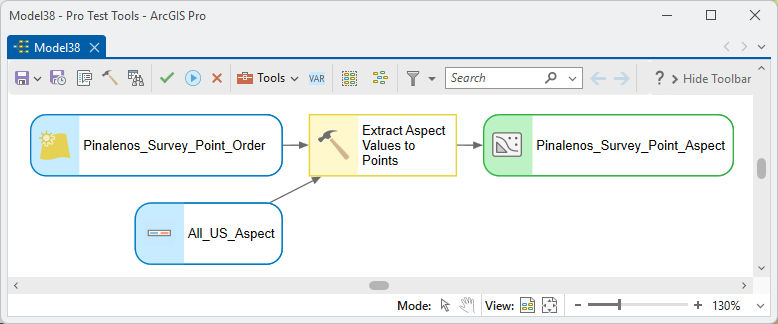
ModelBuilder
Parameters
| Label | Explanation | Data type |
|---|---|---|
| Input point featuresRequired · in_points | The points to extract aspect for. An active selection is honored. Single-point features only; multipoint feature classes are not accepted. | Feature Layer |
| Input aspect raster (single band)Required · in_raster | A single-band aspect raster in degrees, 0 to 360 clockwise from north, with −1 for flat cells. A D-infinity flow-direction raster is also valid with the convention set to Mathematical. The tool warns if the values fall outside −1 to 360. | Raster Layer |
| Output point featuresRequired · out_points | The new point feature class: a copy of the input points with all their attributes plus the new aspect field. A name is suggested from the input. | Feature Class |
| Interpolate values at the point locations (weighted mean direction)Optional · interpolate | Unchecked (default): each point gets the value of the cell it falls in, as stored, including −1 for flat. Checked: each point gets the bilinear weighted mean direction of the four surrounding cell centers, with flat and NoData neighbors left out and the weights renormalized; all-flat neighbors give −1. | Boolean |
| Output field nameOptional · field_name | The name of the new DOUBLE field. Default Aspect; adjusted if the name is not valid for the output workspace or is already in use. | String |
| Input aspect conventionRequired · input_convention | Compass (0 = north, clockwise) for ordinary aspect, or Mathematical (0 = east, counter-clockwise; e.g. D-infinity) for a D-infinity flow-direction raster, whose values are then converted to compass degrees. Set automatically when the raster's history identifies a D-infinity raster. | String |
Python
interpolate is True or False. The input_convention
strings are exactly "Compass (0 = north, clockwise)"
and "Mathematical (0 = east, counter-clockwise; e.g.
D-infinity)". The new field is DOUBLE, in compass degrees;
−1 is flat; NULL (geodatabase) or −9999 (shapefile) is
NoData or outside the raster.
import arcpy
arcpy.ImportToolbox(r"C:\path\to\JennessEnterprisesTools.pyt")  # your installed path is shown in this tool's run messages

# Value of the cell each point falls in (no interpolation)
arcpy.jenness.ExtractAspectValuesToPoints(
    in_points=r"C:\Project\Wildlife.gdb\telemetry_points",
    in_raster=r"C:\Project\Terrain.gdb\aspect",
    out_points=r"C:\Project\Wildlife.gdb\telemetry_points_Aspect",
    interpolate=False,
    field_name="Aspect",
    input_convention="Compass (0 = north, clockwise)")

# Circular (weighted mean direction) interpolation from the 4 nearest cells
arcpy.jenness.ExtractAspectValuesToPoints(
    in_points=r"C:\Project\Wildlife.gdb\telemetry_points",
    in_raster=r"C:\Project\Terrain.gdb\aspect",
    out_points=r"C:\Project\Wildlife.gdb\telemetry_points_AspInterp",
    interpolate=True,
    field_name="Aspect")
Recommended citation
Credits and references
By Jeff Jenness, Jenness Enterprises (www.jennessent.com). The tool is modeled on Esri's Extract Values to Points; the weighted mean direction follows the circular statistics of Batschelet (1981), Fisher (1993), Mardia and Jupp (2000) and Zar (1999), as set out for wildlife work in Jenness (2012).
- Batschelet, E. 1981. Circular Statistics in Biology. Academic Press, London. ISBN 0-12-081050-6.
- Esri. Extract Values to Points (Spatial Analyst). ArcGIS Pro tool reference. pro.arcgis.com. Accessed on 27 September 2026.
- Fisher, N. I. 1993. Statistical Analysis of Circular Data. Cambridge University Press, Cambridge. doi.org/10.1017/CBO9780511564345
- Jenness, J. 2012. Issues with directional data. Remotely Wild, newsletter of the Spatial Ecology and Telemetry Working Group of The Wildlife Society. PDF
- Mardia, K. V., and P. E. Jupp. 2000. Directional Statistics. Wiley, Chichester. doi.org/10.1002/9780470316979
- Zar, J. H. 1999. Biostatistical Analysis, 4th edition. Prentice Hall, Upper Saddle River, New Jersey. (Chapter 27, circular statistics.)
Licensing information
Works at every ArcGIS Pro license level (Basic, Standard, Advanced). No extension licenses are required; the extraction and the circular interpolation are computed internally, without Spatial Analyst.
Related tools and pages
- About Aspect — why aspect matters, and why it needs circular arithmetic.
- Aspect Focal Statistics — circular statistics over a neighborhood of cells.
- Aspect Transformation — classes, northness and eastness, and deviation from a bearing.
- Aspect Zonal Statistics as Table — circular statistics by zone, including point zones.
- Projecting Rasters — why the raster is read in its own coordinate system.