

Corridor Analysis Data Report
Summary
A read-only window that answers a question many of us eventually find ourselves asking: “where did this raster come from?” Every tool in the Corridor Designer chain stamps its outputs with a machine-readable analysis record — inputs, parameters, and the analysis id inherited from its ancestors — and this window reads those records back as a plain-language report: which clustering run produced the facets, which variables and neighborhood built the density, which statistics fed the Mahalanobis surface, which termini and slices made the corridor. Months later, or in a project handed over from someone else, the provenance is in the data itself rather than in anyone's memory.
Reading a chain
Pick any dataset produced by the Corridor Designer chains — a facet raster, a density band, a cost surface, a corridor polygon, a Cumulative Surface — and the report walks its ancestry, appending each record-carrying source's own history. Datasets from different analyses combined into one output (the normal case for a multi-species union or cumulative surface) are reported as such, each lineage separately. The report can be copied out for project documentation.
The metadata behind it
The report is only possible because every Corridor Designer tool writes a special record into the metadata of every dataset it creates: what tool ran, when, with which inputs and which parameter settings, and the analysis identifier it inherited from the datasets it was built from. That record does three jobs besides feeding this window. It lets the tools prefill their dialogs, so Land Facet Density reads the facet list from the facet raster and Land Facet Mahalanobis reads the variable rasters, in order, from it. It lets them check their inputs: Mahalanobis refuses a density raster built from a different clustering run, and warns when the variables are not the ones the clustering used or are given in a different order, two mistakes that would otherwise produce plausible-looking nonsense. And it lets Least-Cost Corridor match each facet's termini to its own cost surface in a workspace of eighteen. The report is the same record read back for a person.
A tour of the window
Here we show an example from the end of the Land Facet Tutorial: the cumulative surface of the nineteen strands, described. The window traces both of its inputs back through their own histories, the interspersion corridor through the diversity surface and the facet corridors through density, and both through the clustering run that started everything.
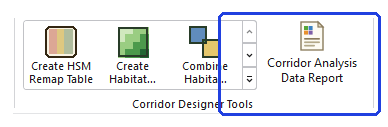
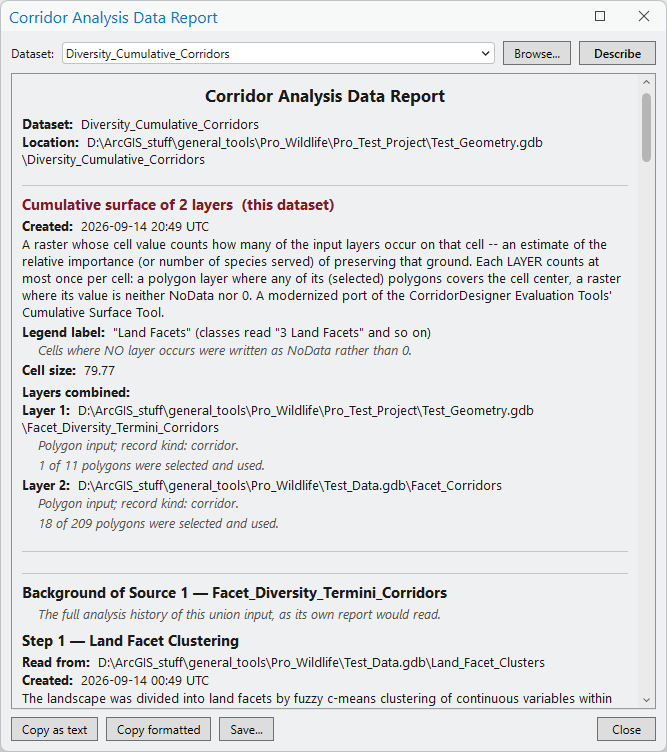
What the report documents, read top to bottom: the dataset and where it is stored; how it was made and with what settings; every input, by full path, with how much of it was used; and then, for each input that carries a record of its own, that input's whole history, step by step, back to the raw variables and the categorical raster the facets were defined from. Months later, or in a project handed over from someone else, that is the answer to how the analysis was run, what parameters were set, where the datasets are, and what was created.
Recommended citation
Credits and references
By Jeff Jenness, Jenness Enterprises (www.jennessent.com).
Licensing information
Works at every ArcGIS Pro license level (Basic, Standard, Advanced). No extension licenses are required.
Related tools and pages
- Land Facet Tutorial — the chain whose records this window reads.
- Cumulative Surface and Union Corridors — the multi-lineage combiners.