

Cumulative Surface
Summary
Combines any mix of polygon layers and rasters into one integer raster whose cell value counts how many of those objects occur on that cell — a way of estimating the relative importance, or the number of species served, of preserving that ground. Built to stack patch maps and corridor rasters across species (which ground serves six species' corridors? which serves one?), but it combines any polygon/raster mix. A modernized port of the CorridorDesigner Evaluation Tools' Cumulative Surface tool; no Spatial Analyst needed.
What counts as “present”
A raster counts on a cell when its value there is neither NoData nor zero — a corridor raster's 0 background never counts. Keep that rule in mind when combining arbitrary rasters whose 0 is meaningful data. A polygon layer counts where any of its polygons covers the cell center — and it counts once there even where several of its polygons overlap each other. That layer-level counting is the difference from Esri's Count Overlapping Features: here, two overlapping patches of the same species still mean one species served. Each map layer's selection is honored independently, using the Use the selected records switch Pro shows under each layer, and a layer with no selection contributes all its polygons.
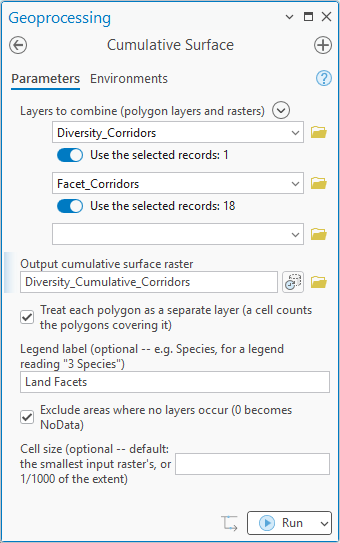
The exception is by request. With Treat each polygon as a separate layer checked, every polygon feature counts as its own layer, so a cell's value is the number of polygons covering it. That is how one feature class holding a corridor per land facet, or per species, is combined without exporting each corridor on its own: select the slices you want and check the box. A multipart feature counts once; several single-part features that overlap each count, so dissolve a strand stored as separate parts first if that is not what you want. Rasters still count once each. The Land Facet Tutorial uses this to count eighteen facet strands and the interspersion corridor from two feature classes.
The shared grid
Every raster input must share one coordinate system — the tool refuses otherwise, because resampling presence between projections would silently shift it. Polygon layers may be in any known coordinate system; they are projected on the fly (true-curve polygons are densified first, so geodatabase circles and arcs rasterize correctly). The output takes the first raster's coordinate system, a cell size equal to the smallest among the input rasters (overridable), the union of every input's extent, and a grid snapped to the smallest-cell raster's own origin so raster presence never shifts by a fraction of a cell.
A legend ready to draw
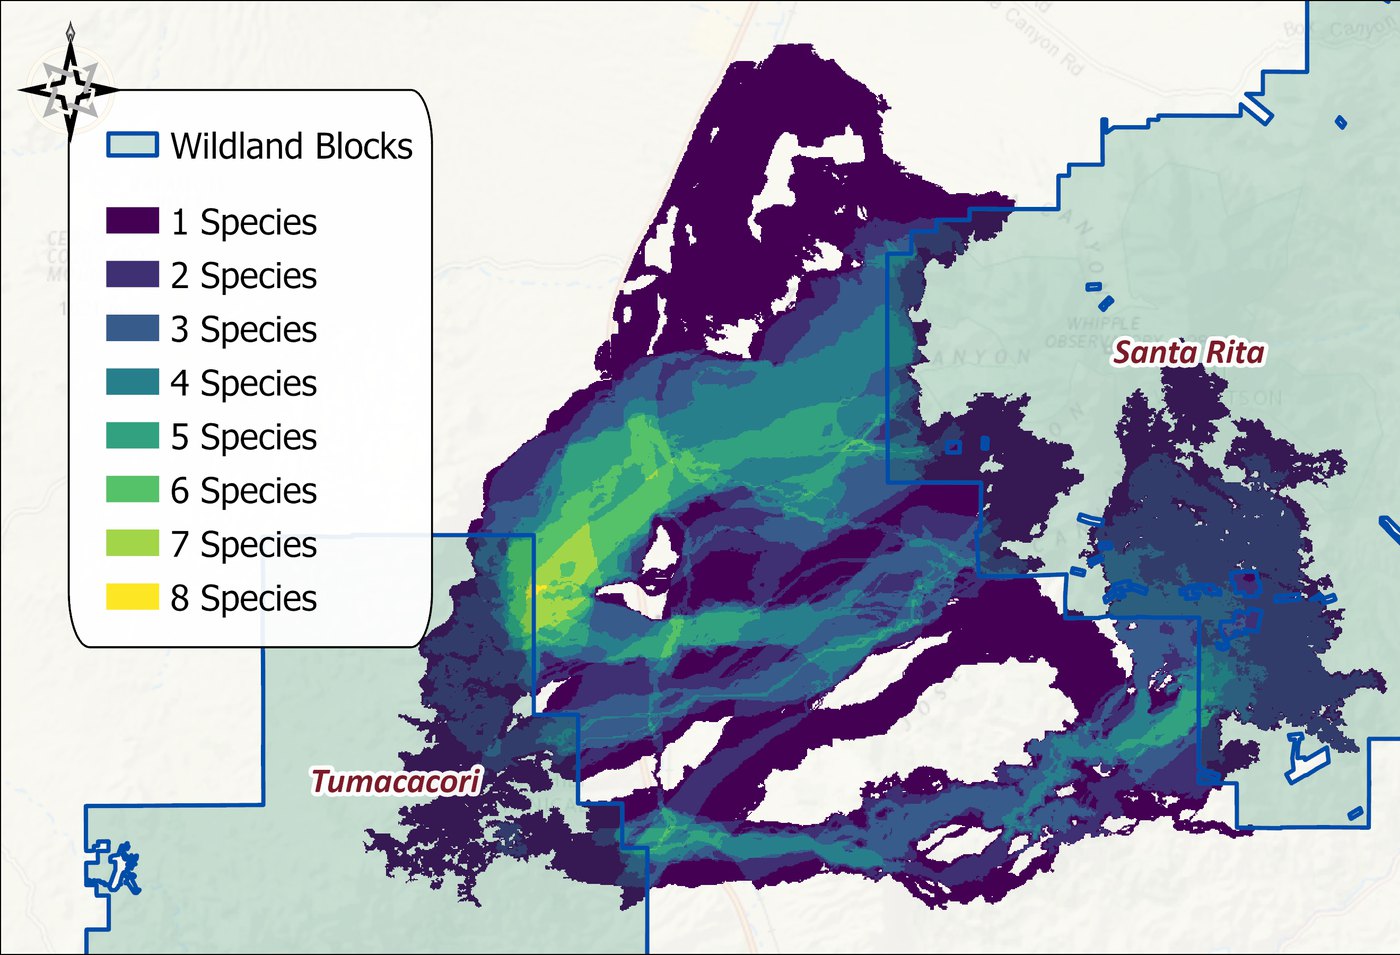
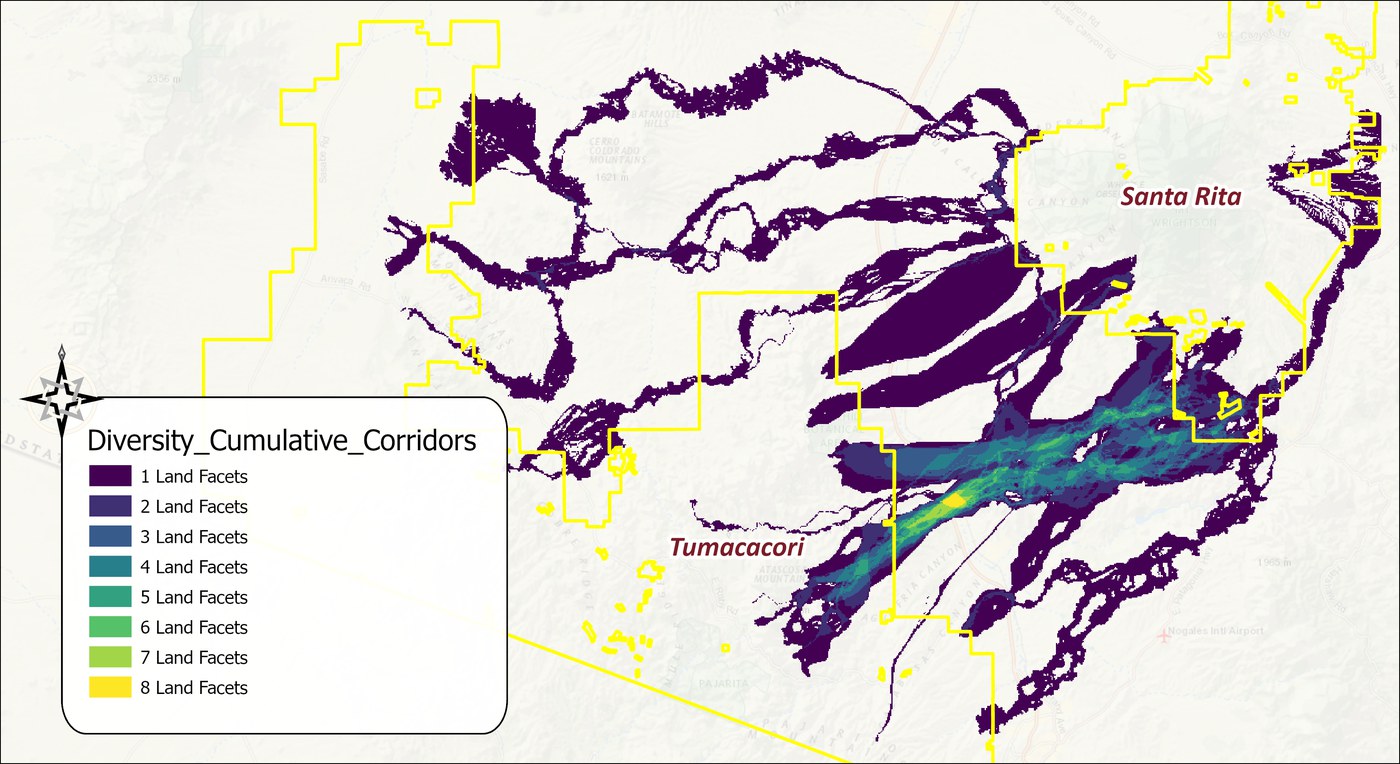
The output is a small integer raster with a value attribute table (Value / Count / Class_Name) and shipped symbology: 0 in white, then the color-blind-friendly viridis ramp from dark violet (fewest layers) to bright yellow (most). The original shaded red through yellow to green — the classic red–green color-blindness confusion — so this version switched ramps. The optional legend label word is appended to each class (“0 Species”, “1 Species”, …), and the no-layers background can be written as NoData instead of the white 0 class when it would hide layers underneath.
Provenance
The output carries a machine-readable linkage record listing every source layer with its selection state and analysis identifiers; the Corridor Analysis Data Report window reads it back, appending each source's own analysis history. Combining sources from different analyses — one corridor per species — is this tool's normal use, and the report says so rather than warning.
A tour of the dialog
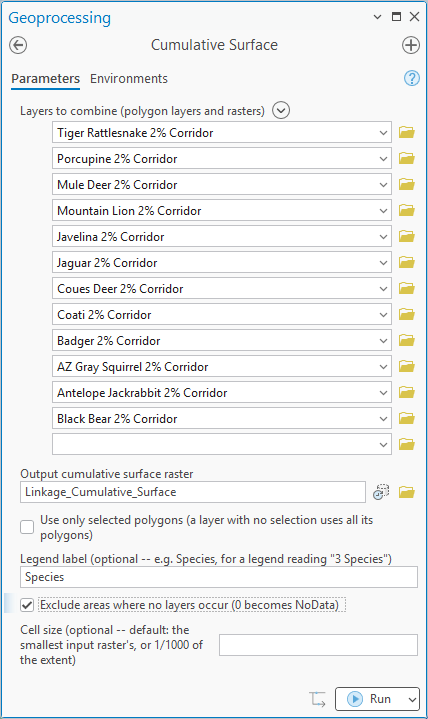
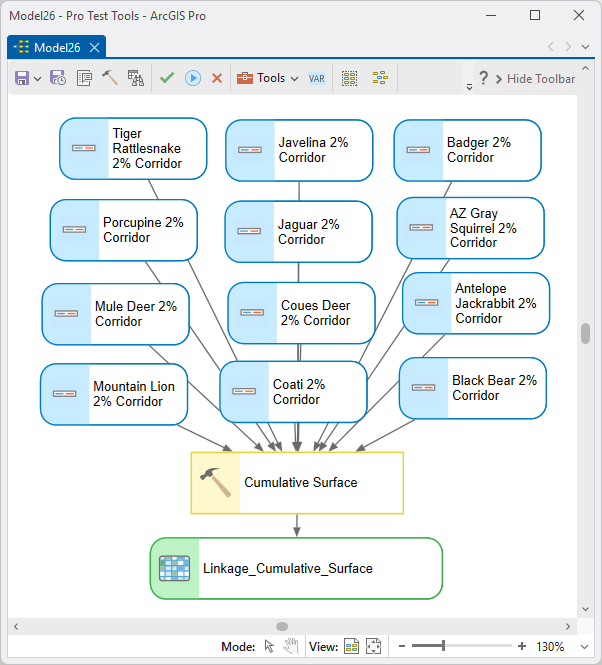
The example below is the twelve-species linkage from the Corridor Design Tutorial: each species' 2% corridor polygon as an input, and a count of how many cover each cell as the output.
The per-feature mode, from the Land Facet Tutorial: two feature classes with the 1% slices selected, eighteen facet strands in one and the interspersion corridor in the other, counted feature by feature.
The tool builds the whole output grid in memory at once, so the memory it needs grows with the number of cells. On most grids that is no concern. On a very large one the tool may need more memory than your computer has free, and then one of two things happens: Windows starts using the disk as overflow memory and the tool slows to a crawl, or the tool stops with an out-of-memory error. There is no fixed limit; it depends on how much memory your computer has free. If the grid is too large, set a larger Cell size.
ModelBuilder
Parameters
| Label | Explanation | Data type |
|---|---|---|
| Layers to combineRequired · datasets | Any mix of polygon layers/classes and rasters; drag several from Contents at once or multi-select from disk. | Multiple Value |
| Output cumulative surface rasterRequired · out_raster | The integer count raster, with VAT and viridis symbology. | Raster Dataset |
| Treat each polygon as a separate layerOptional · per_feature | Checked, every polygon feature counts as its own layer and a cell counts the polygons covering it; unchecked (default), a layer counts once wherever any of its polygons lies. Selections and layer definition queries are honored either way: only the polygons the layer shows, or the selected ones among them, are counted. | Boolean |
| Legend labelOptional · legend_label | Word appended to each legend class (“Species”). | String |
| Exclude areas where no layers occurOptional · zero_to_nodata | Write the 0 class as NoData instead of white. | Boolean |
| Cell sizeOptional · cell_size | Override the default (smallest input raster cell, or 1/1000 of the longest extent edge for all-polygon inputs). | Double |
Python
import arcpy
arcpy.ImportToolbox(r"C:\path\to\JennessEnterprisesTools.pyt")  # your install path
arcpy.jenness.CumulativeSurface(
    datasets=r"D:\corr.gdb\bear_corridor;D:\corr.gdb\deer_corridor;D:\corr.gdb\coati_patches",
    out_raster=r"D:\corr.gdb\Species_Served",
    legend_label="Species")
Recommended citation
Credits and references
By Jeff Jenness, Jenness Enterprises (www.jennessent.com), ported from the CorridorDesigner Evaluation Tools by Jenness, Majka and Beier.
- Beier, P., D. Majka, and J. Jenness. 2007, revised 2026. Designing wildlife corridors with ArcGIS: ArcGIS Pro edition. Workshop book, revised by J. Jenness for the Corridor Designer Tools of the Wildlife and Forestry Tools add-in. Available at: CorridorDesigner_WorkshopBook_2026_ArcGISPro.pdf (5 MB)
- Jenness, J., D. Majka, and P. Beier. 2014. CorridorDesigner Evaluation Tools. Available at: corridordesign.org (archived copy at the Internet Archive)
Licensing information
Works at every ArcGIS Pro license level (Basic, Standard, Advanced). No extension licenses are required.
Related tools and pages
- Corridor Evaluation Tutorial — where this tool stacks the single-species corridors.
- Land Facet Tutorial — the same trick applied to facet strands.