

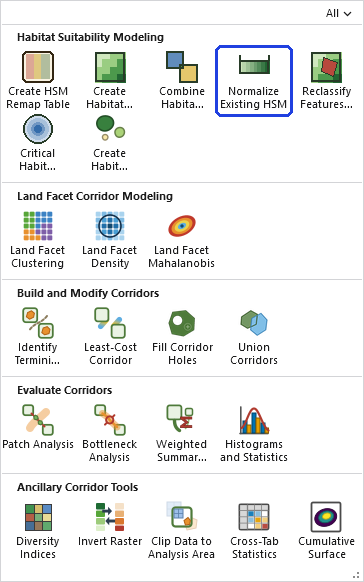
Normalize Existing HSM
Summary
Linearly stretches a habitat suitability model built outside this tool chain — a logistic-regression probability surface on 0–1, a Maxent output, an expert model on 1–10, any consistent scale — onto the 0–100 suitability scale the CorridorDesigner chain expects. You name the value in your model that means worst habitat (it becomes 0) and the value that means best (it becomes 100); everything between stretches proportionally: output = ((x − worst) / (best − worst)) × 100. A model where low values mean good habitat inverts naturally — just give a worst value larger than the best. A modernized port of the CorridorDesigner Normalize Existing HSM tool; no Spatial Analyst needed.
The anchors are meanings, not the raster's min and max
The two values you supply are the values that mean worst and best habitat in your model's own terms — for a probability surface, worst 0 and best 1, even if the raster's actual values only span 0.03 to 0.91. Anchoring to what you know are the best and worst possible values in that scale, rather than to observed extremes, keeps the output comparable across models and study areas — a 0.91 cell stays a 91, not an artificially perfect 100. Values beyond the anchors are clamped to 0–100 by default. Once normalized, line your model up against the scale's biological anchor points (100 / 80 / 60 / 30 / 0 — see Create Habitat Suitability Model) before trusting downstream patch thresholds.
A tour of the dialog
To show the tool at work we need a suitability surface that did not come out of the Corridor Designer chain, so here is a hypothesis rather than an expert's model. Suppose we suspect that habitat quality in the black bear landscape is affected by which way the ground faces, and specifically by how far a slope's aspect departs from a compass bearing of 45°. The idea has a pedigree: Trimble and Weitzman (1956), studying oak site index in the northern Appalachians, found that northeast slopes grew the best oaks and southwest slopes the worst, with everything else in between, and they built that finding into a transformation of aspect that scores each slope by how close it faces to northeast. If the vegetation a bear depends on follows the same rule, then deviation from 45° is a habitat factor worth trying, and it arrives on a scale of its own: 0° for a slope facing exactly northeast, 180° for one facing exactly southwest.
The Aspect Transformation tool (in the Aspect Tools of the Topographic Analysis group) makes that raster directly: from an aspect raster of the clipped DEM, its Numeric deviation from a bearing transform with the target bearing left at its default of 45° writes the angular difference, in degrees, between each cell's aspect and northeast.
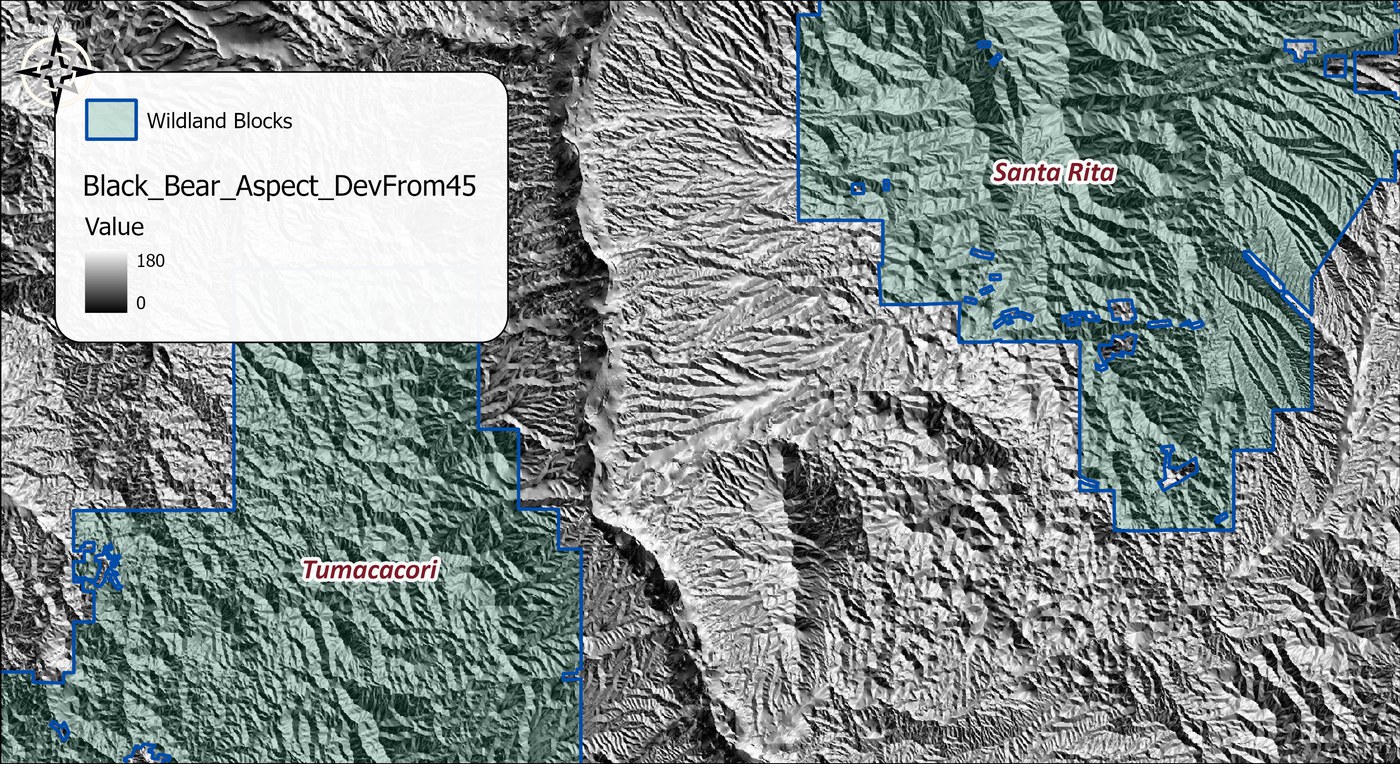
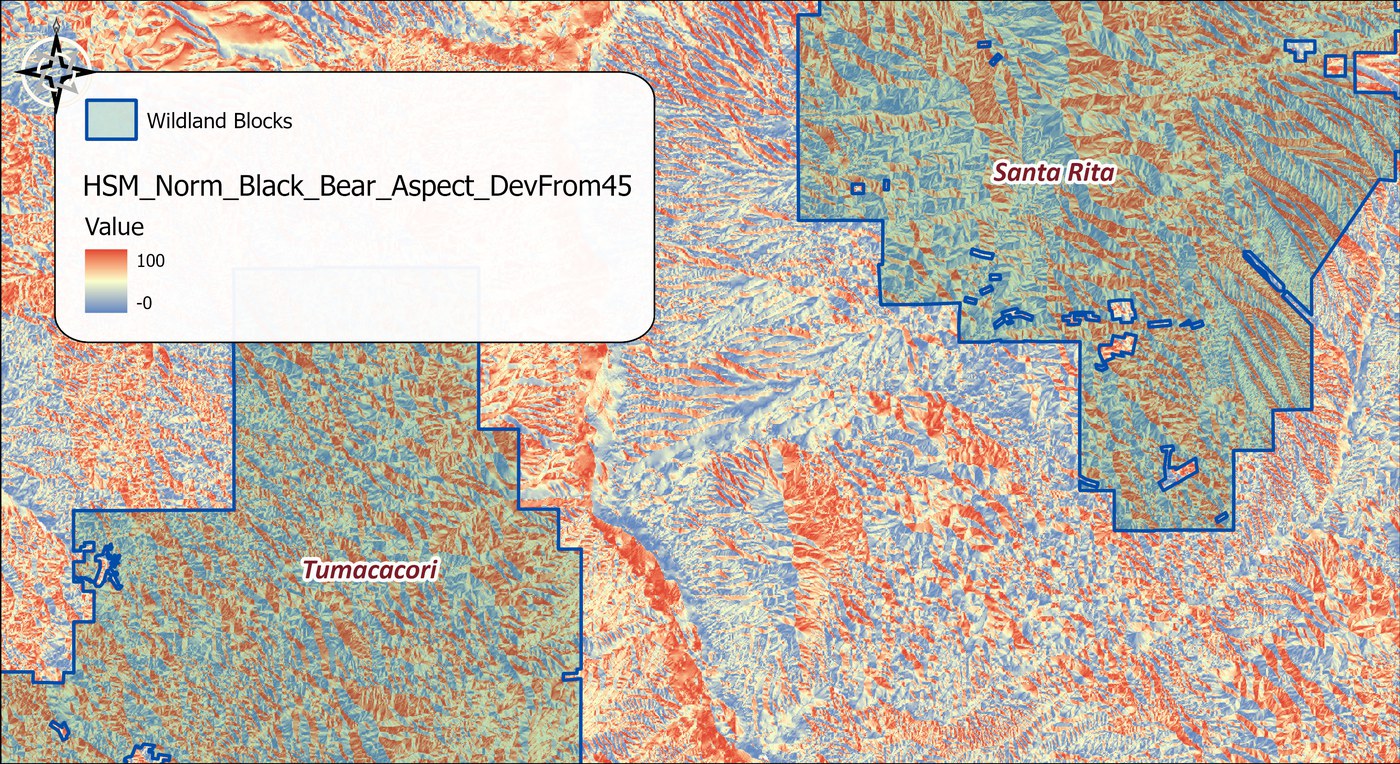
Now the normalization. Under our hypothesis the best possible value in this raster is 0, a slope facing exactly northeast, and the worst possible value is 180, a slope facing exactly southwest. Those are the anchors, and they are anchors of meaning: no cell in the study area needs to hit either extreme for them to be right. Because the worst value is larger than the best, the tool inverts the scale as it stretches it, and a deviation of 45° becomes a suitability of 75, a deviation of 135° a suitability of 25.
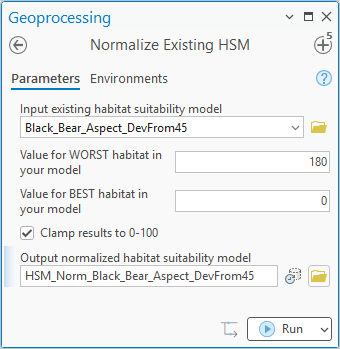
- Input existing habitat suitability model. The raster to normalize, on whatever scale it came in: a probability, an index, a deviation in degrees.
- Value for WORST habitat and Value for BEST habitat. The two anchors, in the raster's own units. Worst becomes 0 and best becomes 100. Give a worst value larger than the best, as here, to invert a raster where low means good.
- Clamp results to 0–100. On by default: any cell beyond the anchors is pinned to 0 or 100 rather than running past the scale. Uncheck it only if you want to see how far outside the anchors the data reach.
- Output normalized habitat suitability model. The name and location of the 0–100 result. A name inside a geodatabase gives a geodatabase raster; a name in a folder gives a GeoTIFF.
Whether aspect really belongs in a bear's habitat model is a separate question, and one the expert would have to answer. The point of the example is that a factor arriving on any scale at all, once you can say what its best and worst values mean, is two numbers away from joining the model.
The tool holds the whole raster in memory at once, so the memory it needs grows with the number of cells. On most rasters that is no concern. On a very large one the tool may need more memory than your computer has free, and then one of two things happens: Windows starts using the disk as overflow memory and the tool slows to a crawl, or the tool stops with an out-of-memory error. There is no fixed limit; it depends on how much memory your computer has free. If a raster is too large, clip it to the area you need first.
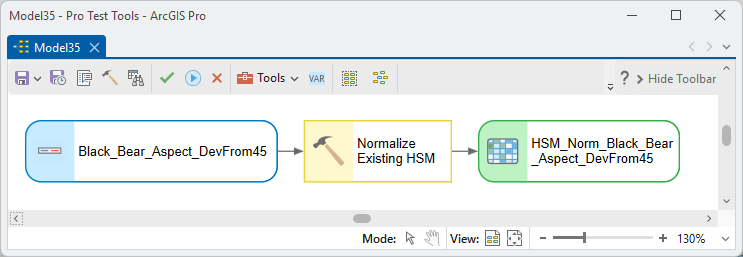
ModelBuilder
Parameters
| Label | Explanation | Data type |
|---|---|---|
| Input existing habitat suitability modelRequired · in_raster | The external model, on any consistent scale. | Raster Layer |
| Value for WORST habitatRequired · worst | Becomes 0. May exceed best to invert a low-is-good model. | Double |
| Value for BEST habitatRequired · best | Becomes 100. | Double |
| Clamp results to 0–100Optional · clamp | Values beyond the anchors are pinned to the scale (default on). | Boolean |
| Output normalized HSMRequired · out_raster | The 0–100 surface, ready for the rest of the chain. | Raster Dataset |
Python
import arcpy
arcpy.ImportToolbox(r"C:\path\to\JennessEnterprisesTools.pyt")  # your install path
arcpy.jenness.NormalizeExistingHSM(
    in_raster=r"D:\models\occupancy_prob.tif",
    worst=0, best=1,
    out_raster=r"D:\corr.gdb\occupancy_hsm")
Recommended citation
Credits and references
By Jeff Jenness, Jenness Enterprises (www.jennessent.com), ported from the CorridorDesigner tools by Jenness, Majka and Beier.
- Beier, P., D. Majka, and J. Jenness. 2007, revised 2026. Designing wildlife corridors with ArcGIS: ArcGIS Pro edition. Workshop book, revised by J. Jenness for the Corridor Designer Tools of the Wildlife and Forestry Tools add-in. Available at: CorridorDesigner_WorkshopBook_2026_ArcGISPro.pdf (5 MB)
- Majka, D., J. Jenness, and P. Beier. 2007. CorridorDesigner: ArcGIS tools for designing and evaluating corridors. Available at: corridordesign.org (archived copy at the Internet Archive)
- Trimble, G. R., Jr., and S. Weitzman. 1956. Site index studies of upland oaks in the northern Appalachians. Forest Science 2:162–173. doi.org/10.1093/forestscience/2.3.162
Licensing information
Works at every ArcGIS Pro license level (Basic, Standard, Advanced). No extension licenses are required.
Related tools and pages
- Aspect Transformation — the deviation-from-a-bearing raster normalized in the example above.
- Create Habitat Suitability Model — the chain this tool lets external models join.
- Combine Habitat Factors — normalized surfaces can serve as factors there too.