

Kernel Density to Proportion Surface
Summary
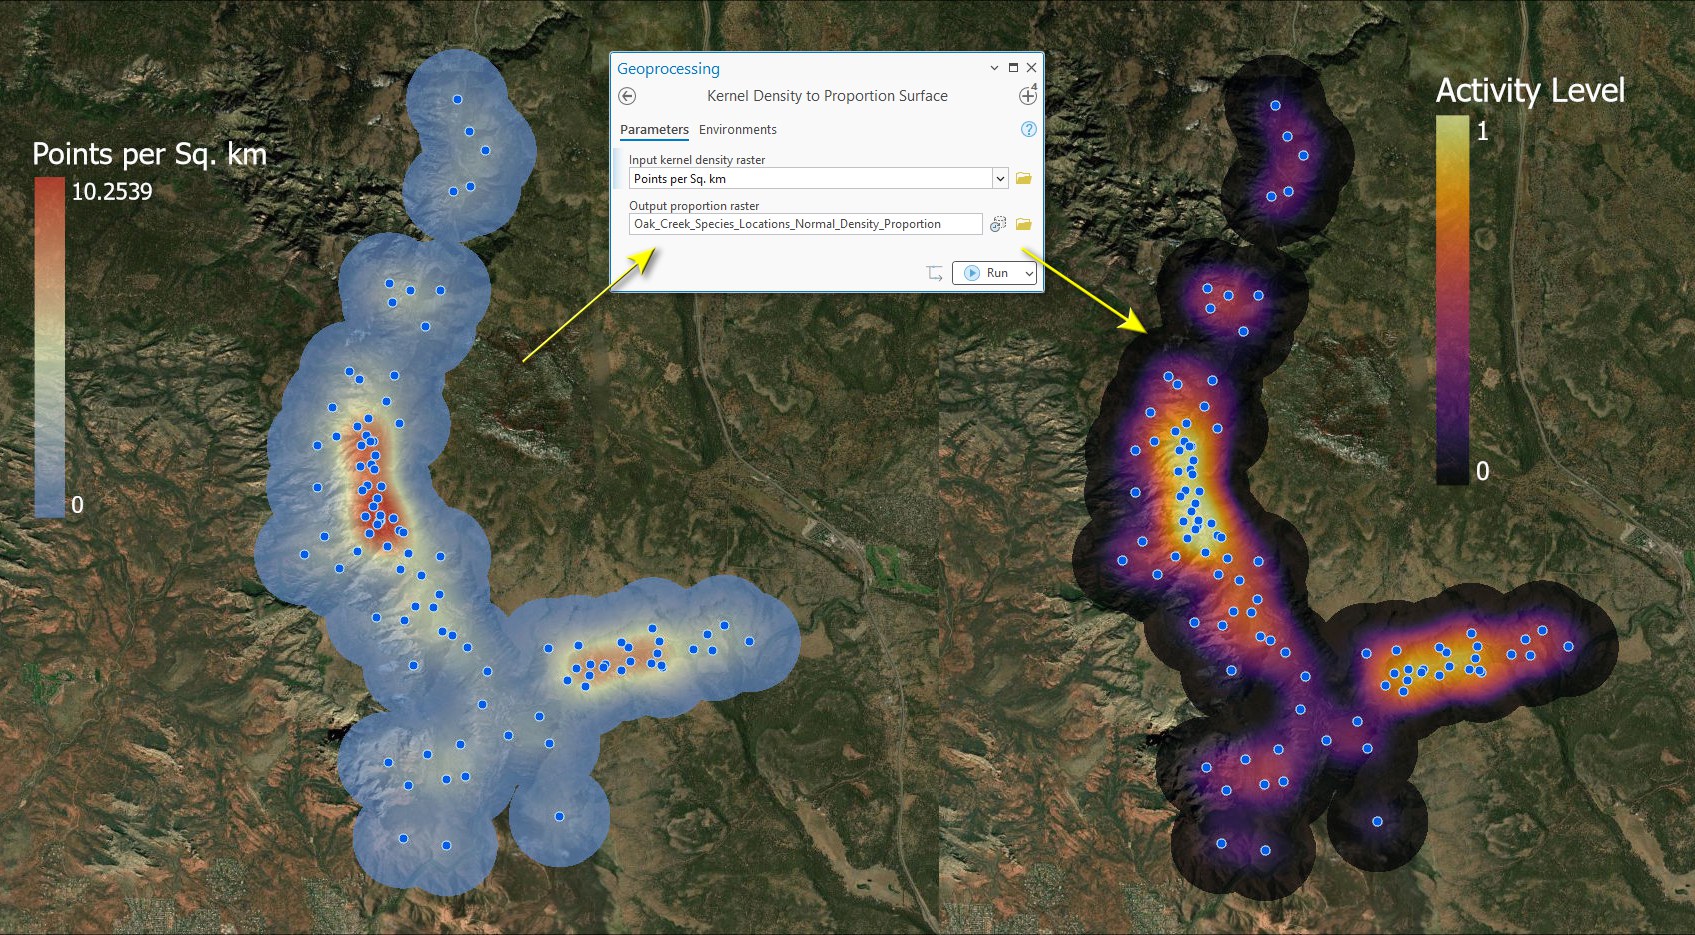
Converts a kernel density raster into a proportion-under-the-surface (volume) raster: each cell holds the cumulative proportion of the total volume under the density surface, running from about 0 at the outer edge to 1 at the peak. Density units — points per area — vary with sample size and bandwidth and make poor thresholds; proportions are the consistent currency for home ranges and core areas, comparable across animals and across runs.
How it works
The “volume” under a kernel density surface is simply the sum of all cell values (on a projected raster the cell area is constant, so it cancels out of every proportion; latitude/longitude rasters are covered below). For each cell, the tool reports the share of that total volume contributed by all cells whose density is less than or equal to the cell's own density. The result is oriented like the raw density surface — low at the edges, 1.0 at the peak — but rescaled to a 0-to-1 range with a fixed meaning. Zero and NoData cells are excluded from the volume.
On a latitude/longitude raster the cells are not all the same size: they narrow toward the poles. The volume under the surface is density times cell area, so the tool needs to know what the cell values are. If they are densities, each cell is weighted by its true area. If they are expected counts, the area is already in the values, and the cells are ranked by the count a cell of average size would hold, which is their density. The tool reads the answer from the raster's metadata: Kernel Density Enhanced records what it wrote, and Esri's Kernel Density records its choice in the geoprocessing history. Only when the metadata does not say does the tool assume densities, and the Raster cell values parameter, which appears only for latitude/longitude rasters, then shows a warning so you can correct it. On a projected raster every cell has the same area and none of this matters.
The proportion surface is designed to be contoured: to draw the X% home-range isopleth, contour at 1 − X/100 — 0.05 for the 95% isopleth, 0.50 for the 50% core. Better yet, hand the surface to KD Probability Contours: the tool stamps a marker into the output's metadata, and the contours tool recognizes it automatically and draws the standard isopleth set for you.
The input can be any kernel density raster — Esri's Kernel Density output, or the Densities or Expected counts output of Kernel Density Enhanced. (Kernel Density Enhanced can also produce this proportion surface directly from the points, skipping this step; this tool exists for density rasters you already have.)
Give this tool the whole surface. The tool can only see the cells in the raster, and it treats their total as the whole distribution. A density raster that was trimmed by a Mask, clipped, or cut off by a small Processing Extent is missing part of its volume, so every proportion computed from it is a share of the trimmed surface and not of the animal's full distribution. If you need a masked proportion surface, run Kernel Density Enhanced with the mask and its Proportion under curve output: it computes the proportions from the whole surface and trims them afterward.
Coordinate system behavior
The output mirrors the input raster's grid cell-for-cell and stays in the same coordinate system as the source; the tool does not honor the Output Coordinate System or other analysis environments. The output carries statistics and a histogram, so it renders correctly and stores the statistics with the dataset automatically — and it arrives on the map already symbolized, with a dark-purple-to-yellow ramp at 30% transparency.
A tour of the dialog
Two parameters: the density raster in, the proportion raster out. A latitude/longitude raster adds a third, Raster cell values, described under How it works.
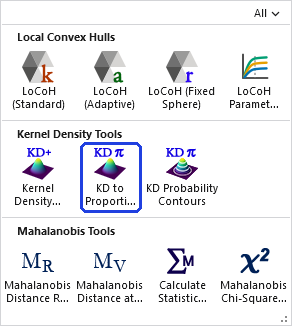
The tool holds the whole raster in memory at once, so the memory it needs grows with the number of cells. On most rasters that is no concern. On a very large one the tool may need more memory than your computer has free, and then one of two things happens: Windows starts using the disk as overflow memory and the tool slows to a crawl, or the tool stops with an out-of-memory error. There is no fixed limit; it depends on how much memory your computer has free. If a raster is too large, clip it to the area you need first.
ModelBuilder
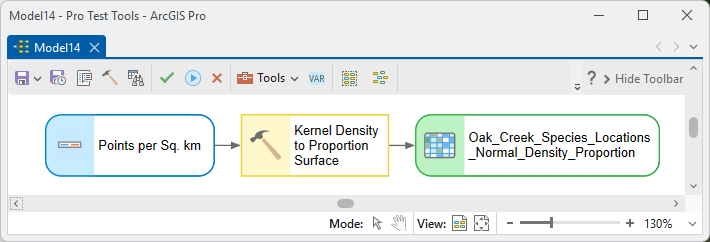
The natural chain is density → proportion → contours: this tool in the middle, feeding KD Probability Contours.
Parameters
| Label | Explanation | Data type |
|---|---|---|
| Input kernel density rasterRequired · in_raster | A kernel density (or any positive intensity) raster; zero and NoData cells are excluded from the volume. | Raster Layer |
| Output proportion rasterRequired · out_raster | The proportion-under-the-surface raster (0 to 1), in the same coordinate system as the input, with the metadata marker the contours tool recognizes. | Raster Dataset |
| Raster cell values (latitude/longitude rasters)Optional · value_kind | Densities or Expected counts. Shown only for a latitude/longitude raster, and filled in from the raster's metadata; Densities is assumed, with a warning, when the metadata does not say. | String |
Python
Convert a density raster, then contour at 0.05 for the 95% isopleth:
import arcpy
arcpy.ImportToolbox(r"C:\path\to\JennessEnterprisesTools.pyt")  # your install path
arcpy.jenness.KernelDensityProportion(
    in_raster=r"D:\data\telemetry.gdb\KD_density",
    out_raster=r"D:\data\telemetry.gdb\KD_proportion")
Recommended citation
Credits and references
By Jeff Jenness, Jenness Enterprises (www.jennessent.com). The volume-isopleth approach to kernel home ranges follows Worton.
- Worton, B. J. 1989. Kernel methods for estimating the utilization distribution in home-range studies. Ecology 70:164–168. doi.org/10.2307/1938423
Licensing information
Works at every ArcGIS Pro license level (Basic, Standard, Advanced). No extension licenses are required.
Related tools and pages
- About kernel density analysis — including the jumping-mice story this tool exists to solve.
- Kernel Density Enhanced — builds the density surface (or the proportion surface directly).
- KD Probability Contours — draws the isopleths from either surface.