

Compare Accuracy Analyses
Summary
Compares the Kappa statistics of two or more accuracy analyses — different models, observers, algorithms or imagery dates: a Z test of each kappa against chance, pairwise Z tests between analyses, and the Fleiss (1981)¶ common-kappa chi-square test of overall equality. Enter each analysis's kappa and variance, both printed by the Classification Accuracy (Kappa) tool. Because the tests run on those two numbers alone, the analyses need not share sample points, software, or even a decade — kappas published in the literature compare just as naturally.
A modernized port of the classic kappa_stats extension's Compare Kappa Analyses tool. There is no equivalent among the standard ArcGIS Pro geoprocessing tools, and no packaged function in R — the comparison arithmetic must otherwise be assembled by hand.
Usage
Answers “is model A actually better than model B?” statistically. Because Cohen's Kappa comes with an estimated variance, two kappas can be compared with a Z test, and a whole set can be tested for overall equality — the classic workflow for comparing predictive algorithms, interpreters, observers, or dates of imagery (Congalton and Mead 1983)¶.
Entering analyses
Enter one row per analysis: a short label, its kappa, and its variance (not the standard error) — both printed by the Classification Accuracy (Kappa) tool's report. At least two rows are required, and any number may be compared at once. The rows may come from your own runs, from a colleague's report, or straight from a published paper — any source that states a kappa and its variance.
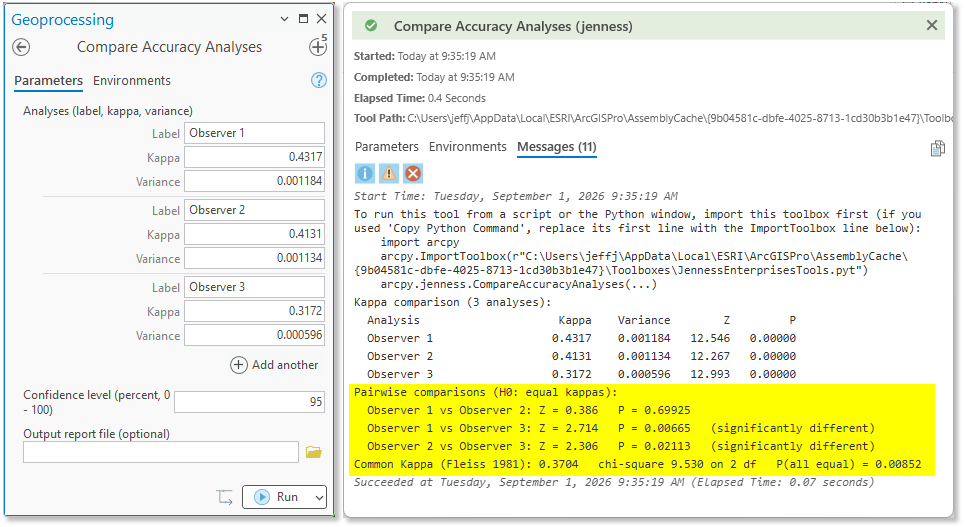
For example, here are the tutorial's two observers joined by a third:
What the report contains
Three blocks, each built from the entered kappa/variance pairs. First, each analysis's own Z test against chance — the sanity floor that its agreement exceeds random labeling:
Second, every pairwise comparison. Under the null hypothesis that two analyses share one true kappa, the difference between their estimates is normally distributed with variance equal to the sum of their variances:
A significant pairwise Z says the two kappas differ beyond what their sampling variances explain. Third, the Fleiss (1981:222)¶ common kappa — the variance-weighted average of all the entered kappas, and the best single estimate if the analyses truly share one value:
with its chi-square test of overall equality on g − 1 degrees of freedom (g = the number of analyses):
When the chi-square rejects, at least one analysis differs from the rest, and the pairwise table shows where; when it does not, the analyses are statistically interchangeable and the common kappa is a defensible pooled summary of all of them.
The screenshot above shows all three blocks working on a real question. Observers 1 and 2 — the tutorial's pair — are statistically indistinguishable (Z = 0.386, P = 0.699). But a third observer, entering with kappa 0.3172 and variance 0.000596, differs convincingly from both: Z = 2.714 (P = 0.007) against Observer 1 and Z = 2.306 (P = 0.021) against Observer 2. The common-kappa test agrees that the three cannot share one value (chi-square 9.530 on 2 df, P(all equal) = 0.009), and the pairwise table shows exactly where the trouble lies: not between the first two observers, but with the third. In practice, a result like this sends us back to the field protocols — perhaps Observer 3 interpreted a class definition differently, or surveyed under different conditions. The statistics cannot say why, but they say plainly who to ask.
Do the analyses need to share sample points?
No — the tests operate on each analysis's kappa and variance, so analyses built on different points, different sample sizes, or different studies entirely compare naturally; that is what makes literature comparisons possible. The tests do assume the analyses are independent, which different samples satisfy exactly. When two analyses are built on the very same points — two observers at one set of plots, or two models judged against one reference set — their kappas are positively correlated and the Z test runs conservative: a significant difference can be trusted, but a genuinely better model may fail to register, and McNemar's paired test (Foody 2004¶) is the sharper instrument for that same-sample case.
The one-run alternative
When all the samples live in one feature class — per observer, per model, per imagery date — the Classification Accuracy (Kappa) tool's analysis field runs these same comparisons automatically in a single pass, and its R snippet then reproduces the entire set. This tool is chiefly for comparing analyses produced separately — including kappas published in the literature, exactly as the original extension intended. The tutorial demonstrates both routes on the same data (Steps 7 and 8) and confirms they agree to the digit.
In R
There is no standard R package function for comparing kappas — the arithmetic above is simple, but must be assembled by hand from psych's kappa-and-variance output, which is precisely why the original extension provided this tool. When the analyses come from the Classification Accuracy tool's analysis field, that tool's ready-to-run R snippet builds the comparison transparently, so the whole report can be verified line by line.
ModelBuilder
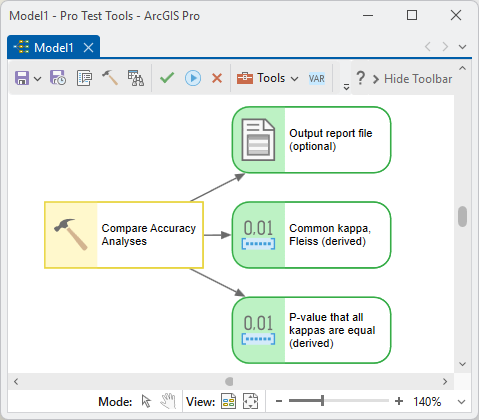
The tool offers three outputs to a model: the optional text report, and two derived scalars — the Fleiss common kappa and the P-value of the all-kappas-equal test — so a model can branch on whether the candidate analyses differ significantly before choosing among them:
Parameters
| Label | Explanation | Data type |
|---|---|---|
| Analyses (label, kappa, variance)Required · analyses | One row per analysis: a short label, the kappa, and its variance (not the standard error) — both printed by the Classification Accuracy tool. At least two rows. | Value Table |
| Confidence level (percent, 0 - 100)Optional · confidence | The significance threshold for flagging pairwise differences (default 95). | Double |
| Output report fileOptional · out_report | A text file holding the comparison report (it also prints in the messages). | File |
| Common kappa, FleissDerived · out_kappa | The variance-weighted common kappa across all the analyses (Fleiss 1981) — the best single estimate if the analyses truly share one kappa. | Double |
| P-value that all kappas are equalDerived · out_p | The chi-square P-value of the test that all analyses share one kappa. Small values mean at least one analysis differs; a model can branch on it. | Double |
Python
The tutorial's two observers, compared from their reports' kappa and variance lines:
import arcpy
arcpy.ImportToolbox(r"C:\path\to\JennessEnterprisesTools.pyt")  # your install path
arcpy.jenness.CompareAccuracyAnalyses(
    analyses=[["Observer 1", 0.4317, 0.001184],
              ["Observer 2", 0.4131, 0.001134]],
    confidence=95,
    out_report=r"D:\data\kappa_comparison.txt")
Recommended citation
Credits and references
By Jeff Jenness, Jenness Enterprises (www.jennessent.com), and J. J. Wynne, Department of Biological Sciences and Center for Adaptive Western Landscapes, Northern Arizona University. A modernized port of the Compare Kappa Analyses tool of: Jenness, J. and J. J. Wynne (2007), Cohen's Kappa and classification table metrics 2.1a (kappa_stats.avx), Jenness Enterprises.
- Congalton, R. G., and R. A. Mead. 1983. A quantitative method to test for consistency and correctness in photointerpretation. Photogrammetric Engineering and Remote Sensing 49:69–74.
- Fleiss, J. L. 1981. Statistical Methods for Rates and Proportions, 2nd ed. John Wiley and Sons, New York. (Common kappa: p. 222.)
- Foody, G. M. 2004. Thematic map comparison: evaluating the statistical significance of differences in classification accuracy. Photogrammetric Engineering & Remote Sensing 70:627–633. doi.org/10.14358/PERS.70.5.627
Licensing information
Works at every ArcGIS Pro license level (Basic, Standard, Advanced). No extension licenses are required.
Related tools and pages
- Classification Accuracy (Kappa) — produces the kappa and variance every row of this tool consumes, and runs these comparisons automatically via its analysis field.
- Estimate Sample Size — how many reference samples an assessment needs.
- About Kappa and classification accuracy analysis — the theory behind the variance, the Z test and the comparisons.
- Kappa analysis tutorial — this tool demonstrated on the Pinaleños observers (Step 7).
- Footnotes — what the cited authors actually said, verbatim.