

Attribute Summary Reports
Summary
Counts the records that hold each value of an attribute field, works out each value's share of the total, and writes the result as a report whose every line is laid out the way you want it. How many parcels of each owner type? How many observations in each vegetation class, and what percentage is that? The dataset can be a feature class, a standalone table or a raster with an attribute table. Several fields can be summarized one after another, or together as the unique combinations of their values. The report can also give the size on the ground of each value's features, and statistics of a numeric field within each value: the mean elevation of each type of spring, say, beside the count.
Each report line is built from a format template that you design with a row of buttons and a live sample, so the report can be a simple numbered list, a table for Excel, or a sentence ready to drop into a manuscript or email. The finished report opens in a window of its own, ready to copy as plain text, as formatted text for Word, as a clean table for a spreadsheet, or straight onto a layout.
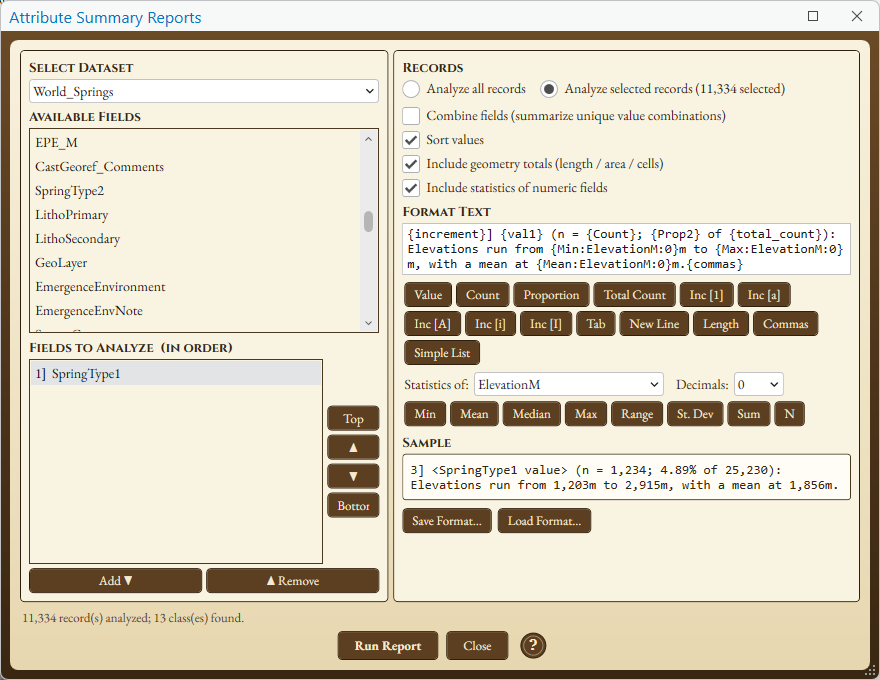
A tour of the window
The left side of the window is where you say what to summarize: the dataset, and the fields in the order you want them. The right side is where you say how: which records, the options, and the format of each line. Run Report at the bottom reads the dataset and opens the report.
The window does not block ArcGIS Pro, and each run opens a new report window, so several reports can sit side by side for comparison.
While it is open, the window follows the map. A layer or table that is added, removed or renamed appears, disappears or changes its name in the Select Dataset list, and when another map becomes the active view, the list changes to that map's datasets. The dataset you are working on stays chosen, with its fields as you left them, for as long as it is in the map.
The dataset and its fields
| Control | Explanation |
|---|---|
| Select Dataset | The feature classes, standalone tables and rasters in the active map. The dataset highlighted in the Contents pane is offered first. A raster is summarized through its attribute table, so it needs to have one. |
| Available Fields | Every field of the dataset that can be summarized. Highlight one or several and click Add, or double-click a field, to move it into the list below. |
| Fields to Analyze (in order) | The fields the report will summarize, numbered in their analysis order. Remove, or a double-click, sends a field back. |
| Top, ▲, ▼, Bottom | Move the highlighted field within the analysis order. |
The order of the second list matters in three ways. It is
the order of the sections when the fields are summarized
separately. When fields are combined, it decides the sorting:
the values are sorted by the first field, then by the second
within each value of the first, and so on. And it decides which
field is {val1}, which is {val2}, and
so on in the format template.
The options
| Control | Explanation |
|---|---|
| Analyze all records / Analyze selected records | Whether a selection on the dataset limits the report. If Analyze selected records is chosen and nothing is selected, all the records are used. The option shows how many records of the dataset are selected at the moment, and the number follows the map as the selection changes. A definition query is always honored: “all records” means all the records the layer shows. |
| Combine fields (summarize unique value combinations) | Unchecked, each field gets a section of its own. Checked, the report has one line for every combination of values that occurs. See One field at a time, or combinations. |
| Sort values | Checked (the default), the values are listed in order: numbers by size, dates by date, and text alphabetically without regard to capitals. Unchecked, they appear in the order they are first met in the table. |
| Include geometry totals (length / area / cells) | Checked (the default), the tool also adds up the size of each value's features, and a Geometry row of placeholder buttons appears under the Format Text box. See Counts vs. Sizes. |
| Include statistics of numeric fields | Checked, the tool also works out statistics of numeric fields within each value, and a Statistics row of placeholder buttons appears. See Statistics within each value. |
One field at a time, or combinations
With several fields in the analysis list, the report can treat them in two ways.
Separately, the default. Each field gets its own section, headed with the field's name, in the order listed. A report on Owner_Type and County has a list of owner types with their counts, and then a list of counties with theirs.
Combined. The report has a single section with one line for every combination of values that occurs in the records: each owner type within each county, or each county within each owner type, depending on which field comes first in the analysis order. This is the form to use when the question is about two attributes at once.
Null values are shown as <Null>.
Summarized separately, the records with no value in a field
make up a class of their own, which comes first in that field's
section and is written with the same format as every other
line. Combined, a missing value takes part in the combinations
like any other. Either way the nulls are part of the total, so
the percentages are shares of all the records analyzed.
A text field can also hold an empty value that is not null. Those records form a class too, and its value is simply blank.
Counts vs. Sizes
A count of records answers one question, and often it is the wrong one. Fifty sliver polygons and one very large polygon are fifty records and one record, and on the ground the single polygon may cover far more. With Include geometry totals checked, the tool adds up the size of the features behind each value, so the report can give each value's share of the landscape as well as its share of the records:
| Dataset | What is totaled |
|---|---|
| Polylines | Geodesic length. |
| Polygons | Geodesic area. |
| A raster with an attribute table | The number of cells, from the table's Count column. For a raster in a projected coordinate system the cell counts are also turned into areas. |
| Points and standalone tables | Nothing. They have no size to total. |
The totals reach the report in three places: a line near the top giving the total length, area or cell count of everything analyzed; the geometry placeholders in the format template, described below; and extra columns in the copied table.
Statistics within each value
A count says how many records hold a value. Often the next question is about some other attribute of those records: how high the springs of each type are, or how large the parcels of each owner type. With Include statistics of numeric fields checked, the report can answer it. For each value, the tool takes the records that hold it and works out statistics of any numeric field you name:
| Statistic | What it is |
|---|---|
| Min, Max | The smallest and the largest value of the field. |
| Mean | The mean of the field. |
| Median | The middle value, or the mean of the two middle values when their number is even. |
| Range | The maximum minus the minimum. |
| St. Dev | The sample standard deviation, which divides by n − 1. A single number has none, and the statistic then prints nothing. |
| Sum | The total of the field. |
| N | The number of values the statistics were taken from. |
Records whose statistics field is null are left out, so N can be smaller than the count of records. If none of a value's records has a number in the field, N is 0 and the other statistics print nothing.
To put a statistic in the report, choose the field in
Statistics of and the number of decimal places in
Decimals, then click a statistic. Its placeholder is
written at the cursor with both inside it:
{Mean:ElevationM:1} is the mean of
ElevationM to one decimal place. Choose the field once
and click as many statistics as you want, and choose another
field to add statistics of that one as well. The number at the
end can be changed by hand afterward, as with
{Prop2}. If it is left off altogether, the
statistic is written with two decimal places.
Rasters. Each row of a raster's attribute table stands for many cells, and its Count column says how many. The statistics treat every cell as one observation, so each row is weighted by its cell count. The mean, the median and the standard deviation are weighted by the cell count, N is the number of cells, and the sum is each row's value times its cell count, added up.
The window at the top of this page shows the Statistics row in use, and the third example below shows the report it makes.
The format line
Every line of the report is produced from one template, the Format Text. A template is ordinary text with placeholders in braces, and for each value in the report the placeholders are replaced with that value's own numbers. The buttons under the box insert the placeholders for you at the cursor, and the Sample box shows one finished line, updated as you type.
The buttons come in up to three rows. The first is always there. The Geometry row appears while Include geometry totals is checked, and holds only the buttons the dataset can use: a length for polylines, an area for polygons, cells and an area for a raster. For points and tables, which have no size, it does not appear at all. The Statistics row appears while Include statistics of numeric fields is checked.
The template the window starts with is:
{increment}] {val1} (n = {Count}; {Prop2} of {total_count}){commas}It begins with two spaces, which indent each line. For the eighth value in a report, found in 176 of 11,334 records, it produces:
8] hanging garden (n = 176; 1.55% of 11,334)Change the template and the report changes with it.
Three examples
A list to read. The starting template, here without its indent, turns the types of the selected springs into a numbered list that can go straight into a report:
{increment}] {val1} (n = {Count}; {Prop2} of {total_count}){commas}![The Attribute Summary Reports window with the dataset World_Springs and SpringType1 as the field to analyze. Analyze selected records (11,334 selected) is chosen, Sort values is checked, and the two Include boxes are unchecked. The Format Text box holds {increment}] {val1} (n = {Count}; {Prop2} of {total_count}){commas}, one row of placeholder buttons sits under it, and the Sample box reads 3] SpringType1 value (n = 1,234; 4.89% of 25,230)](../images/asr-window-list.png)
It makes this report:
![An Attribute Summary Report window for the dataset World_Springs, selected records only, 11,334 records analyzed. Under the heading Attribute Field [SpringType1] is a numbered list of fourteen lines, beginning 1] Null (n = 9,103; 80.32% of 11,334) and including 8] hanging garden (n = 176; 1.55% of 11,334). Buttons along the bottom read Copy Raw Text, Copy Rich Text, Copy Table (TSV), Copy Esri Text, Add to Layout, Save to File and Close](../images/asr-report-list.png)
A table for Excel. For the same summary as a table, the template is nothing but placeholders with tabs between them:
{val1}{tab}{Count}{tab}{Prop2}{tab}{total_count}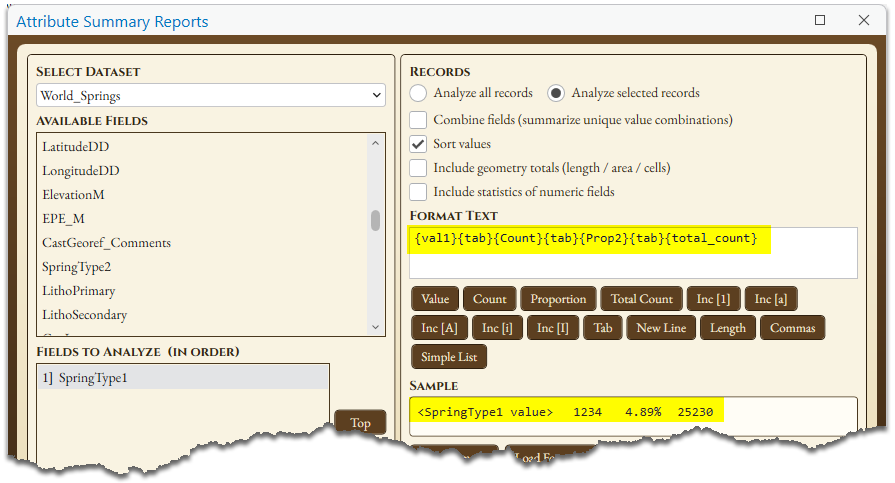
Each line of the report is then a row of values separated by tabs:
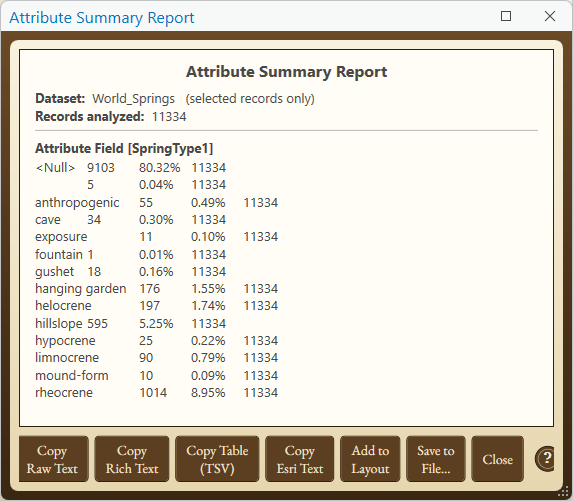
Click Copy Raw Text and paste into Excel. The heading lines land in the first column, and every value of the table lands in a cell of its own. Copy Table (TSV) is the quicker route when its fixed columns are what you want, since it takes no notice of the template. A tab template is for choosing the columns and their order yourself.
An answer to paste into an email. This one is more sophisticated, and it is typical of why I want something simple like this instead of the Esri summarize tools. I might get a request for the elevation ranges of the springs in Arizona, broken up by spring type. (I get this kind of query a lot, working at the Springs Stewardship Institute.) I can easily set the tool up to report that in a way I can just copy and paste into an email. The window at the top of this page shows the setup: Include statistics of numeric fields is checked, and the template ends with a sentence built from three statistics of the ElevationM field:
{increment}] {val1} (n = {Count}; {Prop2} of {total_count}): Elevations run from {Min:ElevationM:0}m to {Max:ElevationM:0}m, with a mean at {Mean:ElevationM:0}m.{commas}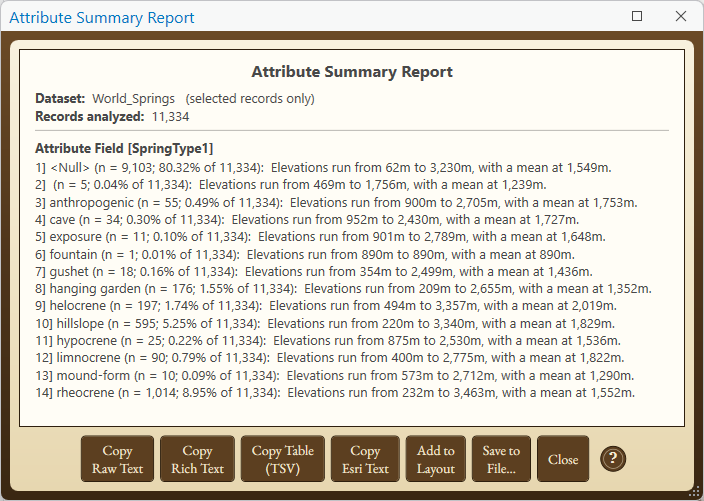
The placeholders
| Placeholder | Becomes |
|---|---|
| {val1}, {val2}, … | The value of the first, second, … field in the
analysis order. When fields are summarized separately,
every section uses {val1}; the higher
numbers are filled only when fields are
combined. |
| {Count} | The number of records with that value. |
| {Prop2} | That count as a percentage of all the records
analyzed. The digit is the number of decimal places:
{Prop0} gives 5%, {Prop2} gives
4.89%, and so on. |
| {total_count} | The total number of records analyzed. |
| {increment} | A running number: 1, 2, 3, … |
| {increment_alpha_lc} {increment_alpha_uc} |
A running letter: a, b, c, … or A, B, C, … After z come aa, ab, and so on, as in spreadsheet columns. |
| {increment_roman_lc} {increment_roman_uc} |
A running Roman numeral: i, ii, iii, … or I, II, III, … |
| {tab} | A tab character. |
| {vbcrlf} | A line break, for an entry that runs over two or more lines. |
| {Length} | The number of characters in the value's text: 14 for
hanging garden. A number or a date is counted as it
is printed, and a null as the six characters of
<Null>. When fields are combined and
the template has more than one value placeholder, it is
the total for those values. |
| {commas} | Prints nothing itself. Its presence anywhere in the template gives the numbers thousands separators: 25,230 in place of 25230. |
| {GeomLength_m} {GeomLength_km} |
The total geodesic length of the value's polylines, in meters or kilometers. |
| {GeomArea_m2} {GeomArea_ha} {GeomArea_km2} |
The total geodesic area of the value's polygons, in square meters, hectares or square kilometers. For a raster in a projected coordinate system, the area of the value's cells. |
| {Cells} | The number of raster cells with the value. |
| {GeomProp2} | The value's share of the total length, area or cell
count, as a percentage. The digit is the number of
decimal places, as with {Prop2}. |
| {Min:Field:2} {Mean:Field:2} {Median:Field:2} {Max:Field:2} {Range:Field:2} {StDev:Field:2} {Sum:Field:2} |
A statistic of the numeric field named in the middle, taken over the value's records. The last number is the decimal places. See Statistics within each value. |
| {N:Field} | The number of values those statistics were taken from. |
Capitals do not matter in a placeholder:
{count} and {Count} are the same. The
geometry placeholders need Include geometry totals to be
checked, and one that does not apply to the dataset, such as an
area for polylines, prints nothing.
The window checks the template as you type. A statistics placeholder that names a field the dataset does not have as a numeric field is underlined in red, a line under the box names the field, and Run Report will not start until it is corrected. A placeholder underlined in amber is not wrong, but will print nothing as things are set: a statistic while Include statistics of numeric fields is unchecked, or a geometry placeholder that the dataset cannot fill.
Keeping a format
Simple List puts the starting template back. Save Format… stores the current template in a small file with a name you choose, and Load Format… brings one back, so a layout that took some care can be used again on any dataset. A format with statistics in it names their fields, so on a dataset that lacks those fields the placeholders are underlined in red until they are changed. The window also remembers the template and the options from your last run and opens with them next time.
The report window
Run Report opens the report. It begins with the name of the dataset, a note if only the selected records were used, the number of records analyzed and, when geometry totals are included, the total length, area or cell count. The sections follow, each under a heading that names its field or fields.
The two examples above each show a report window.
Along the bottom are the ways to take the report somewhere else:
| Button | What it does |
|---|---|
| Copy Raw Text | Copies the report as plain text. |
| Copy Rich Text | Copies the report with its formatting, the bold headings included. Pasted into Word, or any other editor that understands rich text, it arrives formatted. |
| Copy Table (TSV) | Copies a plain table of values, counts and
proportions, whatever the format template says. Pasted
into Excel it lands in columns. The proportions are
written as decimal fractions (0.04891, not 4.89%), and
the geometry totals have columns of their own when they
were included. Each statistic the format uses has a
column too, named for the statistic and its field
(Mean_ElevationM) and written to six decimal
places. |
| Copy Esri Text | Copies the report with ArcGIS text-formatting tags. Pasted into the text of a layout text element, the headings come out bold. |
| Add to Layout | Places the report, formatted, as a text element at the center of a layout. The active layout is used when one is open. Otherwise you choose from the layouts in the project. |
| Save to File… | Saves the report as plain text (.txt), as formatted rich text (.rtf), or as the tab-separated table (.tsv). |
The report windows belong to the main window. Closing the Attribute Summary Reports window closes any reports still open.
How it compares with the Esri tools
ArcGIS Pro has two geoprocessing tools that do similar work. Frequency makes a table of the unique values of one or more fields, with the number of records that hold each. Summary Statistics calculates statistics for the fields of a table, either for all the records or for each unique set of values in its Case Fields, and it is the tool that opens when you right-click a field in an attribute table and choose Summarize. Both work at every license level.
The main difference is what you are left with. Each of the Esri tools writes a new table: the output table is a required parameter. This window makes a report on the screen, laid out the way you designed it, and writes nothing to disk unless you save it.
| Attribute Summary Reports | Frequency and Summary Statistics | |
|---|---|---|
| What you get | A formatted report in a window, ready to copy into a document, a spreadsheet or a layout. | A new table. |
| The layout of the results | Each line follows your format template. | The rows and columns of the output table. |
| Percentages | Each value's share of the records, to the number of decimal places you choose. | Neither tool reports a share of the total. |
| Size on the ground | Measures the geodesic length or area of each value's features, and gives each value's share of the whole. | Work from the fields of the table. A length or an area can be summed only where the table has a field that holds it. |
| Several fields | Each field in a section of its own within one report, or all of them combined. | One table for each run, with a row for each unique combination of the fields. |
| Statistics of a numeric field | The minimum, mean, median, maximum, range, standard deviation and sum within each value, placed wherever you want them in the report line. | Summary Statistics offers those and others, among them the variance, the mode, and the first and last values. |
| Models and scripts | An interactive window. It cannot be run from ModelBuilder or Python. | Geoprocessing tools, so they can. |
The two are complements. For a table that other tools will read, or for a step in a model, use the Esri tools. For counts, percentages and statistics that are going into a report, a manuscript or a map, this window puts them there in the form you want.
Recommended citation
Credits and references
By Jeff Jenness, Jenness Enterprises (www.jennessent.com). A modernized recreation of the Summarize Attribute Fields tool from the Springs Stewardship Institute (SSI) toolbar for ArcMap.
Licensing information
Works at every ArcGIS Pro license level (Basic, Standard, Advanced). No extension licenses are required.
Related tools and pages
- Weighted Summary Statistics — means, medians and other statistics of a numeric field, by record and weighted by geodesic size.
- Cross-Tab Statistics — two categorical variables crossed in one table.
- Histograms and Statistics — the distribution of a field or a raster, drawn as a chart.
- Load Favorite Datasets — add your most-used datasets to the map with one click.
- Select Random Records — select a random or systematic sample of features or table rows.