

Weighted Summary Statistics
Summary
Summarizes numeric attribute fields of a polyline or polygon feature class two ways, side by side: ordinary record statistics (each record one equal vote) and geometry-weighted statistics, where each record is weighted by its geodesic length (polylines) or area (polygons). For attributes describing a per-unit-landscape property — habitat suitability, canopy cover, resistance, road effects — the weighted statistics are the ecologically correct description of the system. An optional case field produces one set of statistics per class; a map layer's selection is honored. No Spatial Analyst needed.
Why weighted statistics tell the truth
An ordinary mean answers “what is the value of an average mapping unit?” — a 1-hectare sliver counts exactly as much as a 5,000-hectare wilderness block. But the animal does not live on mapping units; it lives on the land. The area-weighted mean answers the ecological question: “what is the value of an average hectare?” — the expected value experienced by an animal placed anywhere on the landscape. When a habitat model scores a large block poor and a few small patches excellent, the unweighted mean is misleadingly optimistic; the weighted mean tells the truth about what most of the landscape is like.
A tour of the dialog
The example is the parcel-ownership run from the Corridor Evaluation Tutorial: a county parcel map clipped to the black bear corridor, two attribute fields summarized, one row of statistics per owner type.
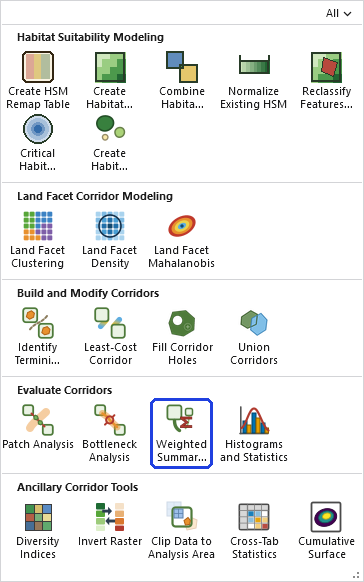
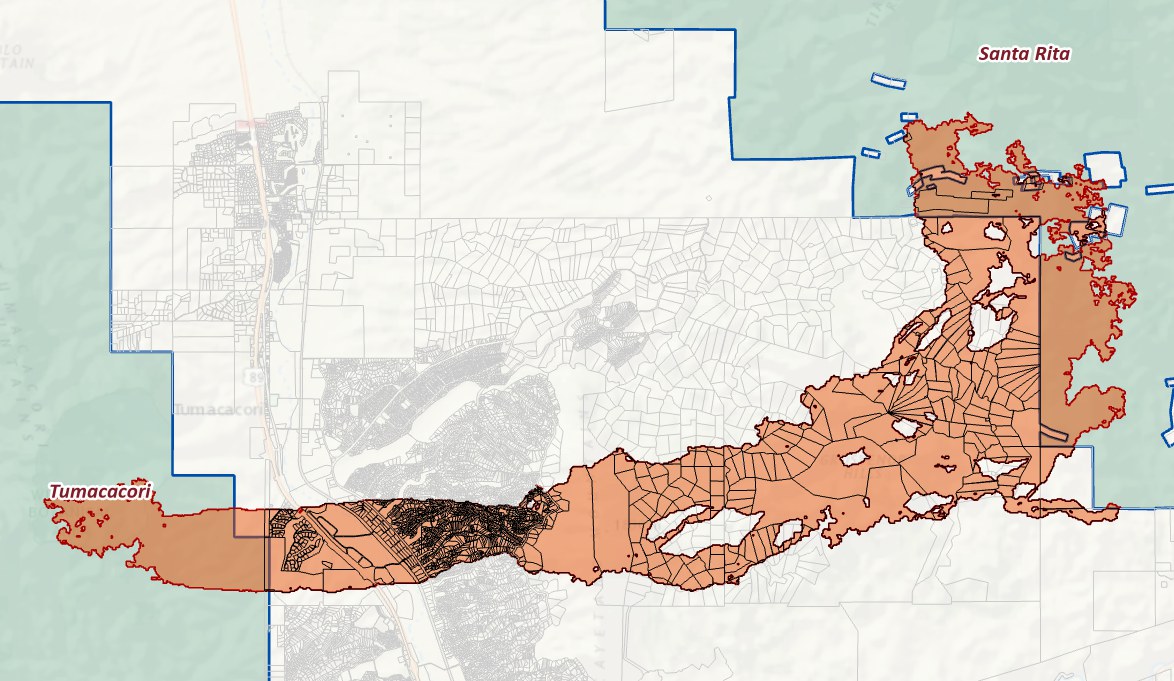
The tutorial walks through why the clip comes first and how to read the two halves of the table.
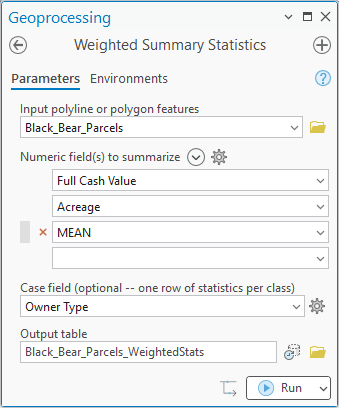
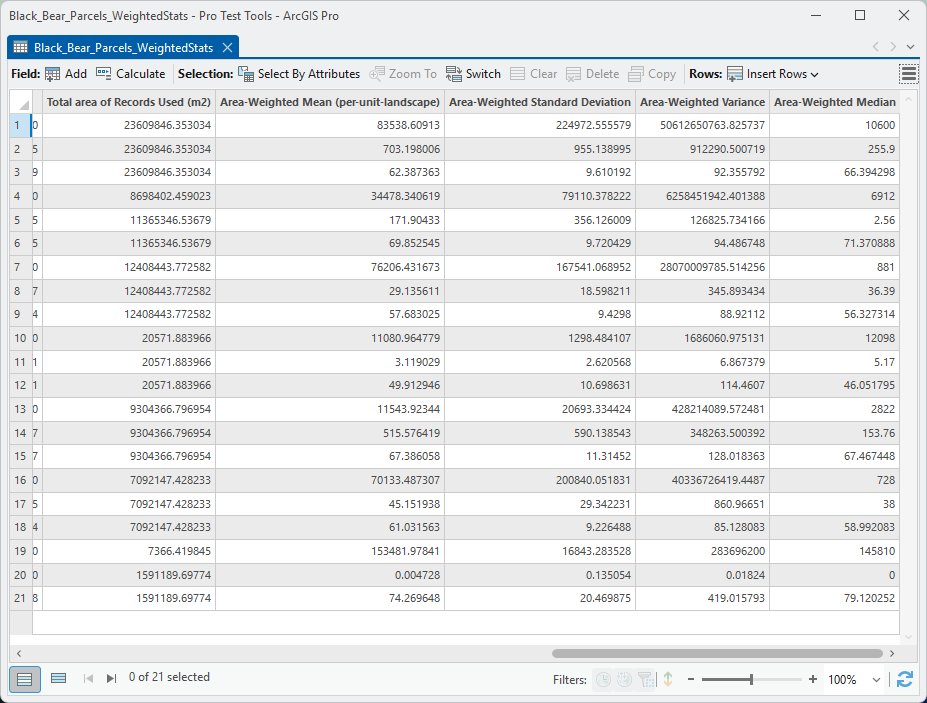
ModelBuilder
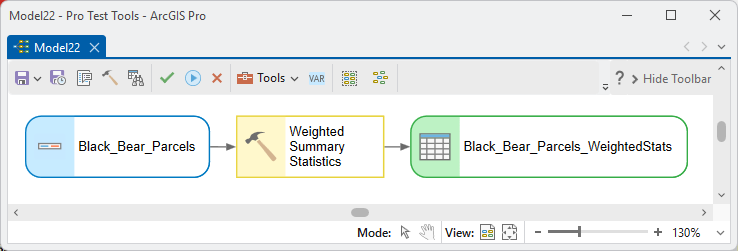
Parameters
| Label | Explanation | Data type |
|---|---|---|
| Input polyline or polygon featuresRequired · in_features | The features to summarize; an active selection is honored. | Feature Layer |
| Numeric field(s) to summarizeRequired · fields | One statistics set per field. | Multiple Value |
| Case fieldOptional · case_field | One row of statistics per class (e.g. per land-cover type, per owner). | Field |
| Output tableRequired · out_table | The paired record and geometry-weighted statistics. A table written to a folder is a dBASE (.dbf) table, which cannot store nulls: a statistic that is undefined there, such as the standard deviation of a single record, is written as −999. In a geodatabase table it is null. | Table |
Python
import arcpy
arcpy.ImportToolbox(r"C:\path\to\JennessEnterprisesTools.pyt")  # your install path
arcpy.jenness.WeightedSummaryStatistics(
    in_features="Corridor_LandCover_Clip",
    fields="Suitability;CanopyPct",
    case_field="Ownership",
    out_table=r"D:\corr.gdb\corridor_stats")
Recommended citation
Credits and references
By Jeff Jenness, Jenness Enterprises (www.jennessent.com), in the lineage of the CorridorDesigner Evaluation Tools' statistics tools by Jenness, Majka and Beier.
- Beier, P., D. Majka, and J. Jenness. 2007, revised 2026. Designing wildlife corridors with ArcGIS: ArcGIS Pro edition. Workshop book, revised by J. Jenness for the Corridor Designer Tools of the Wildlife and Forestry Tools add-in. Available at: CorridorDesigner_WorkshopBook_2026_ArcGISPro.pdf (5 MB)
- Jenness, J., D. Majka, and P. Beier. 2014. CorridorDesigner Evaluation Tools. Available at: corridordesign.org (archived copy at the Internet Archive)
Licensing information
Works at every ArcGIS Pro license level (Basic, Standard, Advanced). No extension licenses are required.
Related tools and pages
- Corridor Evaluation Tutorial — Metric 3 in the evaluation workflow.
- Cross-Tab Statistics — two variables at once.
- Clip Data to Analysis Area — prepare the corridor-clipped inputs.