

Critical Habitat Feature
Summary
Rescales a habitat suitability model by distance from a critical habitat feature — a resource the species must stay near. Neither the geometric nor the additive combining method adequately handles a species absolutely dependent on proximity to one specific resource, and a standard model for such a species can greatly overpredict its habitat: bighorn sheep must stay within about 300 m of the steep escape terrain; many amphibians must stay near perennial water; many rattlesnakes and lizards must stay near rocky outcrops. The remedy is to make suitability decline with distance from the critical feature, in bands you define. A modernized port of the CorridorDesigner Critical Feature tool; no Spatial Analyst needed.
How each cell is scored
The tool computes every cell's straight-line distance to the nearest critical-feature cell, finds the distance band it falls in, and multiplies the cell's suitability by that band's percentage. The workshop book's riparian example, exactly reproducible with this tool's bands: within 30 m of perennial streams the new HSM is 100% of the existing HSM; from 30–60 m, 80%; from 60–100 m, 60%; and beyond 100 m, 0% — not habitat at all. The same mechanism works in reverse for a hazard the species must stay away from: keep a small percentage in the near bands and 100% far away. The critical feature can be a feature layer (selections honored) or a raster. End your bands at a very large distance — cells beyond the last band are left unchanged, with a warning.
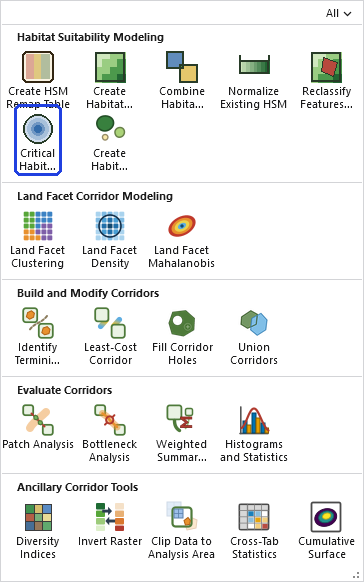
A tour of the dialog
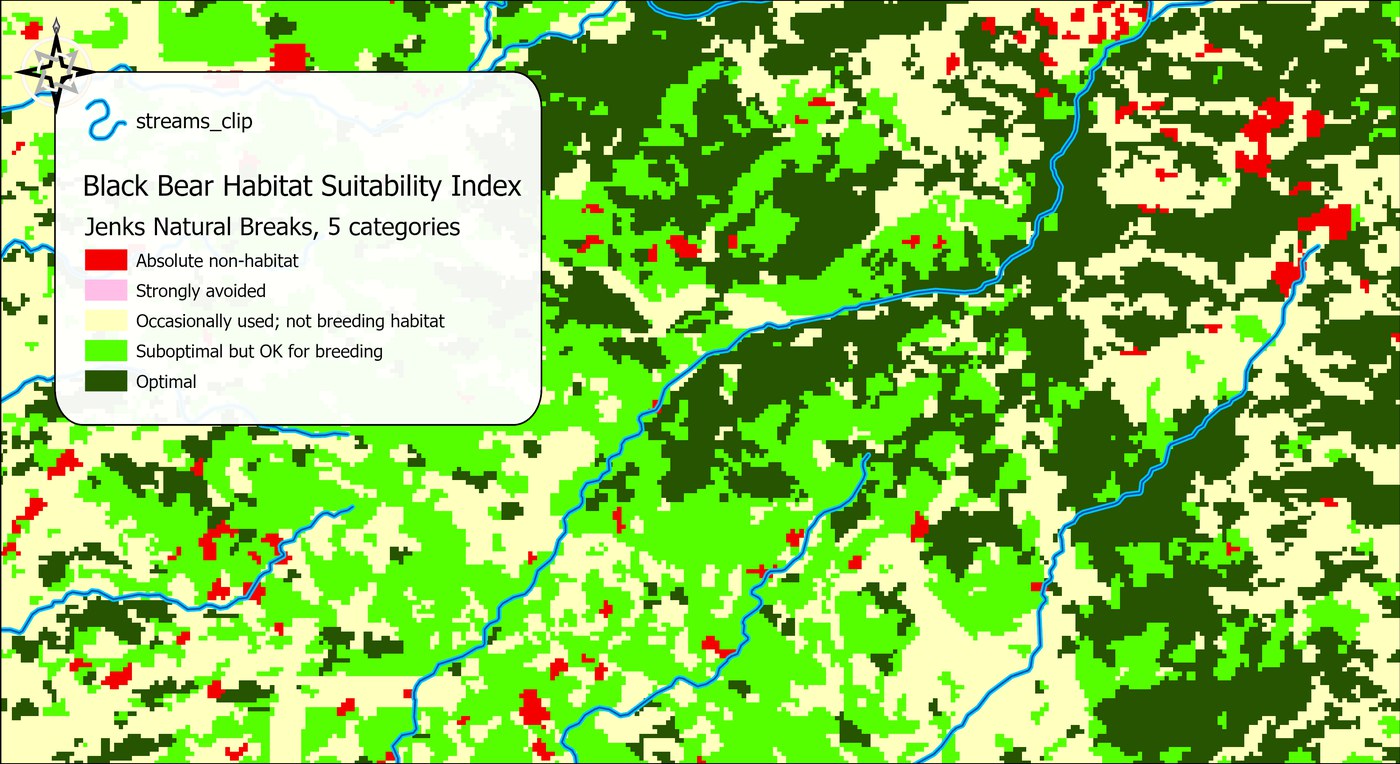
The example applies the workshop book's riparian rule to the black bear model from the Corridor Design Tutorial, with the clipped streams from the tutorial data as the critical feature. Black bears are not in fact riparian obligates, so treat this as a demonstration of the mechanism rather than a claim about bears: the point is what the tool does to a model, which is easiest to see when the effect is drastic. Before the run, the country between the streams is a patchwork of optimal, suboptimal and occasionally-used ground, and the streams themselves make no difference to it.
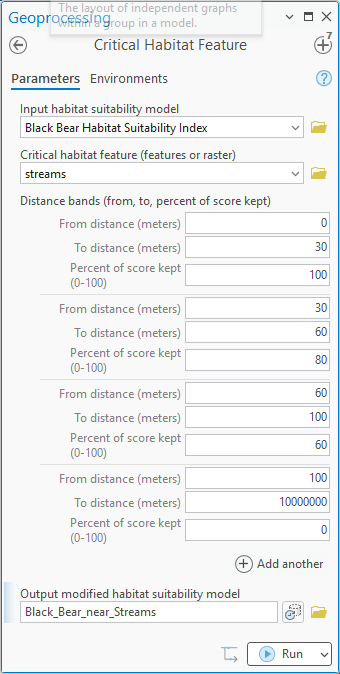
The bands are the book's: within 30 m of a stream the cell keeps 100% of its score, from 30 to 60 m it keeps 80%, from 60 to 100 m it keeps 60%, and beyond 100 m it keeps nothing. The last band runs out to ten million meters so that no cell in the study area escapes it: a cell beyond the last band would be left unchanged, with a warning, which is not what we mean here.
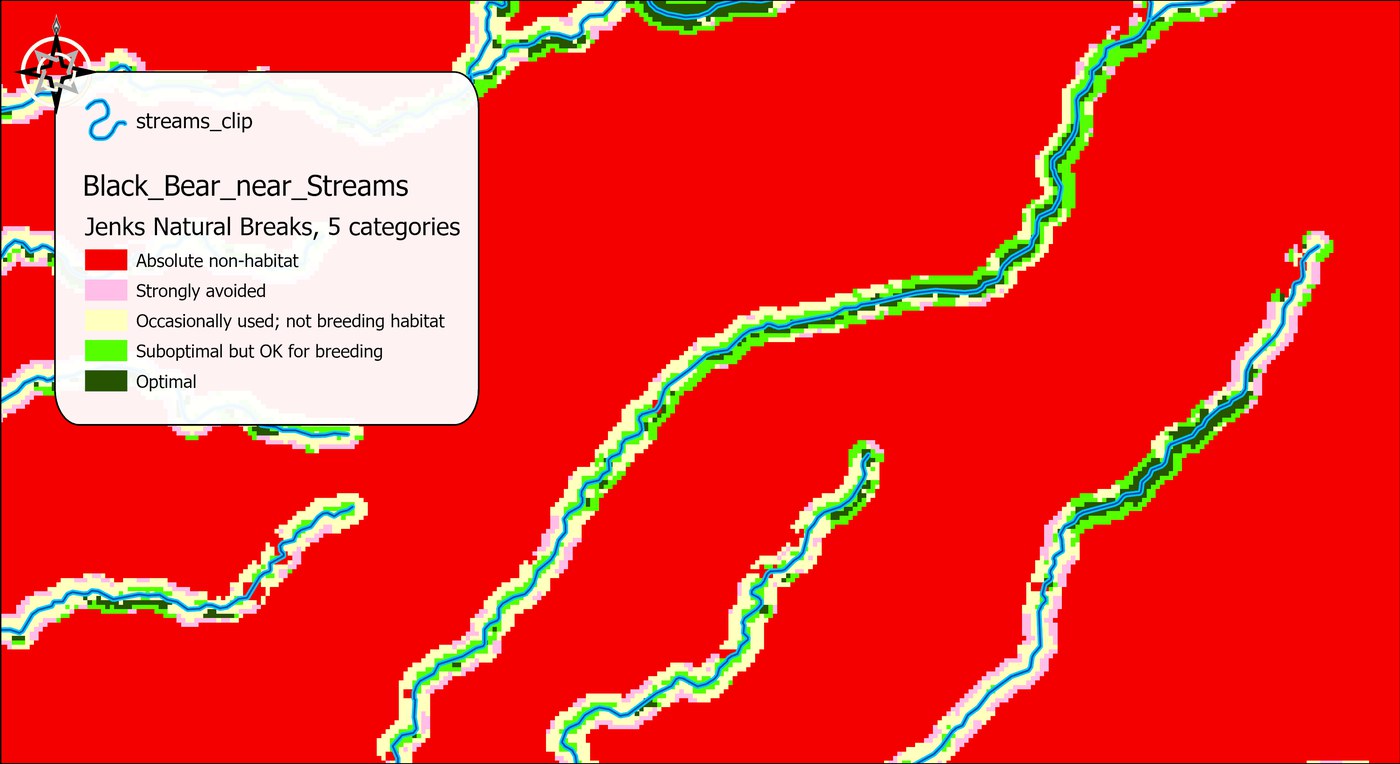
Read the ribbons from the water outward. The innermost cells keep the model's own scores, so along a stream that ran through optimal habitat the core stays dark green, and along one that ran through poorer ground it starts lower. The next band is those scores at 80%, the next at 60%, and then nothing. The five legend classes are natural breaks recomputed on the new raster, which is why the pink strongly-avoided class, empty in the original model, now appears: the 60% band has created a population of middling scores that did not exist before. That is also the reason to look at the numbers rather than the colors when comparing two models.
- Input habitat suitability model. The 0–100 surface to rescale. It is never changed; the tool writes a new raster. The maps above may look like categorical rasters with five classes, but that is only the Jenks classification the symbology applies for display. The underlying raster, before and after, is the traditional continuous 0–100 suitability surface, and the percentages are applied to those numbers, not to the classes.
- Critical habitat feature. The resource the species must stay near, as polygons, lines or points (an active selection is honored, and lines and points are burned so that thin features are not missed) or as a raster. In a raster, every cell with data counts as the feature, except that a raster coded as 1 and 0 treats its zeros as background; so isolate the resource first with a query, a slope threshold or a land-cover class, and make everything else NoData.
- Distance bands. One row per band: the from and to distances in meters and the percent of the score kept. Bands should butt against each other and the last should reach beyond anything in the study area. A hazard the species must avoid is the same table turned around: small percentages near, 100% far away.
- Output modified habitat suitability model. The name and location of the result. A name inside a geodatabase gives a geodatabase raster; a name in a folder gives a GeoTIFF.
The tool holds the whole raster in memory at once, so the memory it needs grows with the number of cells. On most rasters that is no concern. On a very large one the tool may need more memory than your computer has free, and then one of two things happens: Windows starts using the disk as overflow memory and the tool slows to a crawl, or the tool stops with an out-of-memory error. There is no fixed limit; it depends on how much memory your computer has free. If a raster is too large, clip it to the area you need first.
ModelBuilder
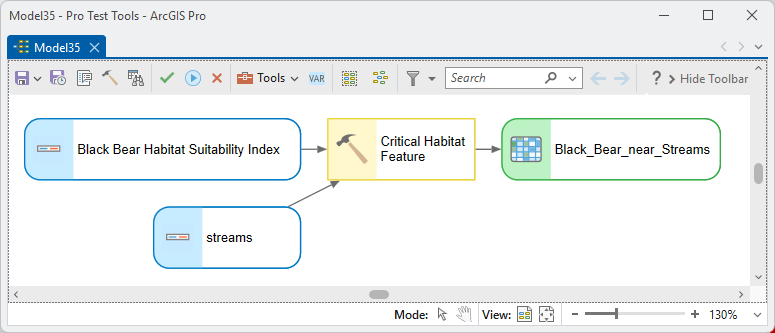
Parameters
| Label | Explanation | Data type |
|---|---|---|
| Input habitat suitability modelRequired · in_hsm | The 0–100 surface to rescale. | Raster Layer |
| Critical habitat featureRequired · in_critical | The resource, as features (selections honored) or a raster. | Feature or Raster Layer |
| Distance bandsRequired · bands | Rows of from-distance, to-distance (meters), and the percent of the score kept in that band. | Value Table |
| Output modified HSMRequired · out_raster | The rescaled surface. | Raster Dataset |
Python
import arcpy
arcpy.ImportToolbox(r"C:\path\to\JennessEnterprisesTools.pyt")  # your install path
arcpy.jenness.CriticalHabitatFeature(
    in_hsm=r"D:\corr.gdb\frog_hsm",
    in_critical="Perennial_Streams",
    bands="0 30 100;30 60 80;60 100 60;100 100000 0",
    out_raster=r"D:\corr.gdb\frog_hsm_water")
Recommended citation
Credits and references
By Jeff Jenness, Jenness Enterprises (www.jennessent.com), ported from the CorridorDesigner tools by Jenness, Majka and Beier.
- Beier, P., D. Majka, and J. Jenness. 2007, revised 2026. Designing wildlife corridors with ArcGIS: ArcGIS Pro edition. Workshop book, revised by J. Jenness for the Corridor Designer Tools of the Wildlife and Forestry Tools add-in. Available at: CorridorDesigner_WorkshopBook_2026_ArcGISPro.pdf (5 MB)
- Beier, P., D. Majka, and J. Jenness. 2007. Designing wildlife corridors with ArcGIS. Workshop book, Northern Arizona University. Available at: corridordesign.org (archived copy at the Internet Archive)
Licensing information
Works at every ArcGIS Pro license level (Basic, Standard, Advanced). No extension licenses are required.
Related tools and pages
- Create Habitat Suitability Model — builds the surface this tool rescales.
- Reclassify Features in HSM — the other HSM modifier, for polygon-mapped influences.