

Mahalanobis Distance — Chi-Square Transform
Summary
Transforms a Mahalanobis squared-distance (D²) raster into a chi-square p-value raster — in effect a 0 to 1 similarity score — rescaling the unbounded D² values onto a fixed 0 to 1 scale where values near 1 indicate a close match to the reference conditions. Mahalanobis distances have no upper limit, which makes surfaces from different analyses hard to compare at a glance; the p-value surface puts them all on the same footing (see Clark et al. 1993).
How it works
For every cell the output is the upper-tail chi-square probability p = P(χ² > D²), evaluated with degrees of freedom equal to the number of variables that produced the D² raster. Because the transform is monotonic, it also inverts the order: high D² (dissimilar) becomes a low p-value, and low D² (similar) becomes a high p-value. The computation processes the raster in manageable blocks of cells, so it won't run out of memory even on very large rasters, and NoData cells remain NoData.
The input must be a squared-distance (D²) raster, not a Distance (D) or already-transformed p-value raster. When the input was created by the Mahalanobis Distance Raster tool, its variable count is recorded in the raster's metadata, and the degrees of freedom are pre-filled automatically; a warning appears if the metadata shows the raster is not a D² surface.
This tool defaults to the statistically standard value, df = number of variables (Mardia, Kent and Bibby 1979; Seber 1984). Some ecological sources instead used the number of variables minus 1 (Clark et al. 1993; Farber and Kadmon 2003). Because the transform is monotonic in D², the choice only rescales the p-values and never changes the ranking of cells — and the degrees of freedom are yours to edit if you wish to reproduce those sources. Farber and Kadmon (2003) also caution that the chi-square interpretation strictly assumes multivariate normality, which habitat variables often fail; even then, the transform still serves as a well-behaved 0 to 1 rescaling.
Why would those authors subtract one? Neither paper shows the derivation, so this is a hypothesis rather than a documented fact — but it looks like a carryover of the most familiar rule in statistics: that estimating a mean from your own sample costs one degree of freedom, as in the n − 1 of a sample variance or a t-test. That rule is about sample size, though. The chi-square result for D² is about the number of variables — each variable contributes one squared standardized deviation to the sum, and estimating the reference mean and covariance from data does not take one of those dimensions away. (The honest correction for estimated statistics is a different, slightly wider distribution — of the Hotelling's T² family — that converges to the chi-square as the sample grows, not a chi-square with one fewer degree of freedom.) Once the n − 1 form appeared in a widely followed methods paper, later authors reasonably adopted it by citation, and it became an ecological convention — later authors including Jeff himself, whose original ArcView Mahalanobis extension followed Clark et al.'s n − 1 convention.
A tour of the dialog
Three parameters: the D² raster in, the degrees of freedom (pre-filled when the metadata knows it), and the p-value raster out.
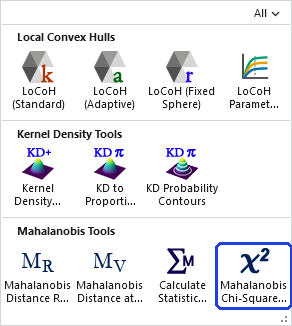
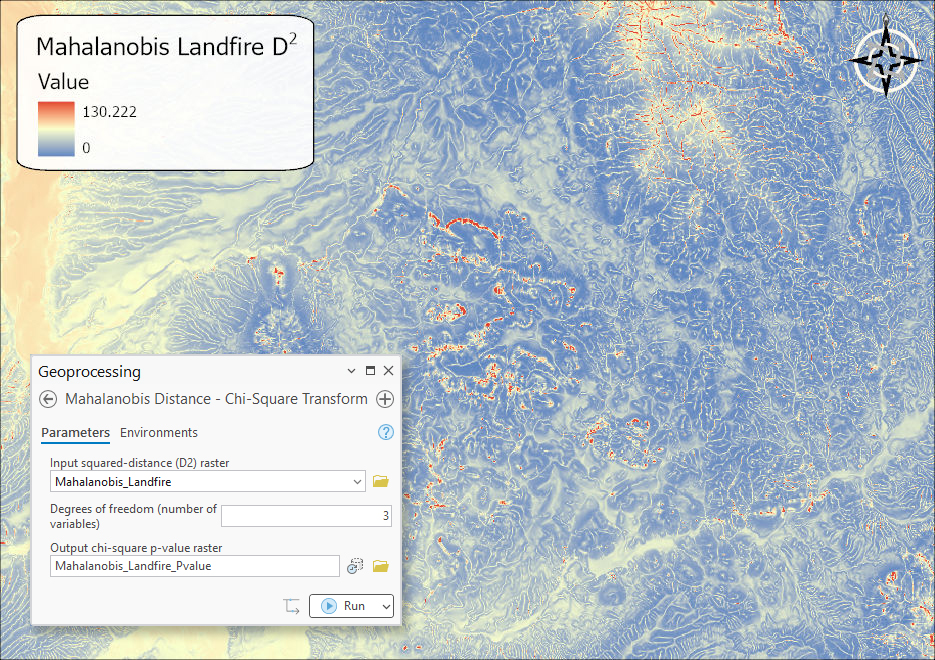
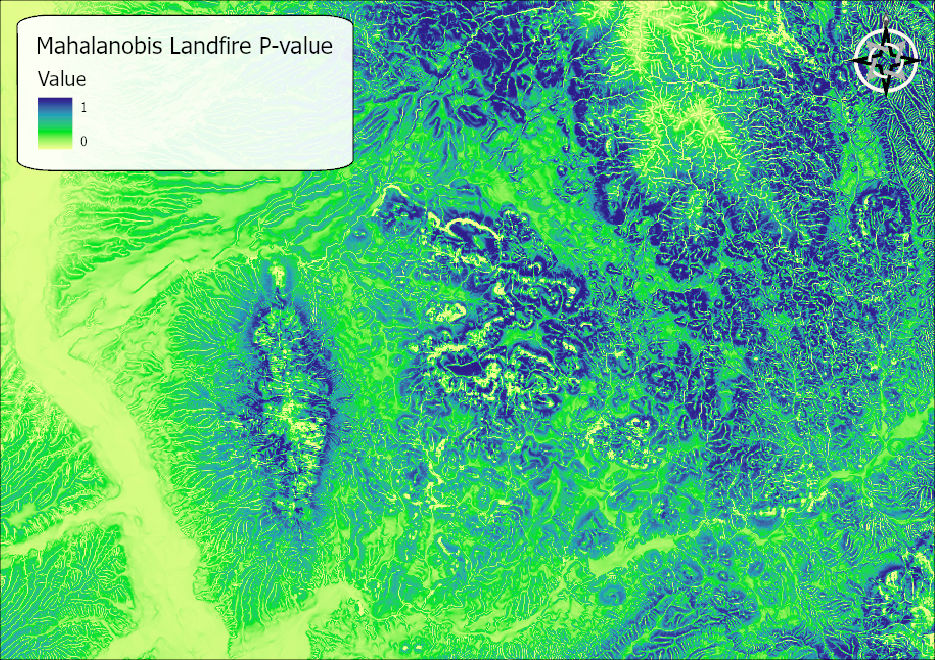
ModelBuilder
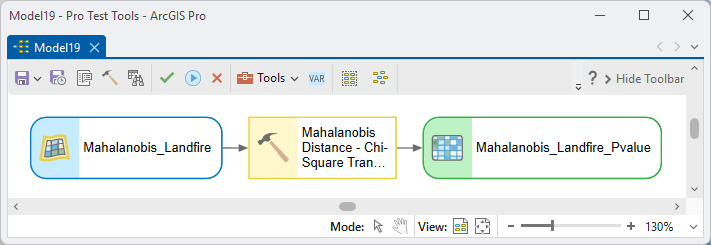
The classic chain: Mahalanobis Distance Raster → Chi-Square Transform → a Reclassify or Con on the p-value surface to pull out candidate habitat above whatever similarity threshold suits your analysis.
Parameters
| Label | Explanation | Data type |
|---|---|---|
| Input squared-distance (D²) rasterRequired · in_raster | The D² raster to rescale — not a Distance (D) or already-transformed raster. Metadata from the Mahalanobis Distance Raster tool pre-fills the degrees of freedom and warns on a non-D² input. | Raster Layer |
| Degrees of freedom (number of variables)Required · df | The number of variables used to build the D² raster; pre-filled from metadata when available, and editable to match other conventions. | Long |
| Output chi-square p-value rasterRequired · out_raster | The 0 to 1 p-value (similarity) surface; defaults to Mahalanobis_Pvalue, auto-incremented. | Raster Dataset |
Python
Rescale a three-variable D² raster (df = 3):
import arcpy
arcpy.ImportToolbox(r"C:\path\to\JennessEnterprisesTools.pyt")  # your install path
arcpy.jenness.MahalanobisChiSquare(
    in_raster=r"C:\Project\Mahalanobis.gdb\Mahalanobis",
    df=3,
    out_raster=r"C:\Project\Mahalanobis.gdb\Mahalanobis_Pvalue")
Recommended citation
Credits and references
By Jeff Jenness, Jenness Enterprises (www.jennessent.com), ported from his ArcView Mahalanobis Distances extension and the ArcMap Land Facet Corridor Tools.
- Clark, J. D., J. E. Dunn, and K. G. Smith. 1993. A multivariate model of female black bear habitat use for a geographic information system. Journal of Wildlife Management 57:519–526. doi.org/10.2307/3809276
- Farber, O., and R. Kadmon. 2003. Assessment of alternative approaches for bioclimatic modeling with special emphasis on the Mahalanobis distance. Ecological Modelling 160:115–130. doi.org/10.1016/S0304-3800(02)00327-7
- Mahalanobis, P. C. 1936. On the generalised distance in statistics. Proceedings of the National Institute of Sciences of India 2(1):49–55. Reprinted 2018 in Sankhyā A 80(Suppl 1):S1–S7. doi.org/10.1007/s13171-019-00164-5
- Mardia, K. V., J. T. Kent, and J. M. Bibby. 1979. Multivariate analysis. Academic Press, London.
- Seber, G. A. F. 1984. Multivariate observations. John Wiley and Sons, New York.
Licensing information
Works at every ArcGIS Pro license level (Basic, Standard, Advanced). No extension licenses are required.
Related tools and pages
- About Mahalanobis distances — the chi-square section explains these p-values in full.
- Mahalanobis Distance Raster — produces the D² input (and can produce the p-value surface directly in one step).
- Mahalanobis Distance at Points — the same p-value per point, via its Mahal_pval field.