![]()
![]()
![]()
![]()
![]()
![]()
Multi-Color Ramping Tools for Legends:
This extension offers two tools to generate customized color ramps for grid legends, enabling you to ramp between multiple colors and generate a large number of color levels. The tools also produce graphic color bars which can be used as attractive legends in layouts or other software.
Rainbow Color Ramps | Custom Color Ramps | General Color Bars
![]()
Rainbow Color Ramps:
This tool generates an array of colors which replicate the visible color spectrum. Click the “Apply Rainbow Color Ramp…” menu item to open the Rainbow Color Ramp Options window:

Select your grid theme and the number of color gradations. This number will reflect the number of classification levels, or individual colors, in your new legend.
You have the option to ramp from Red to Violet or from Violet to Red. In either case the colors will ramp through the visible spectrum:

Click ‘OK’ to generate your new legend:
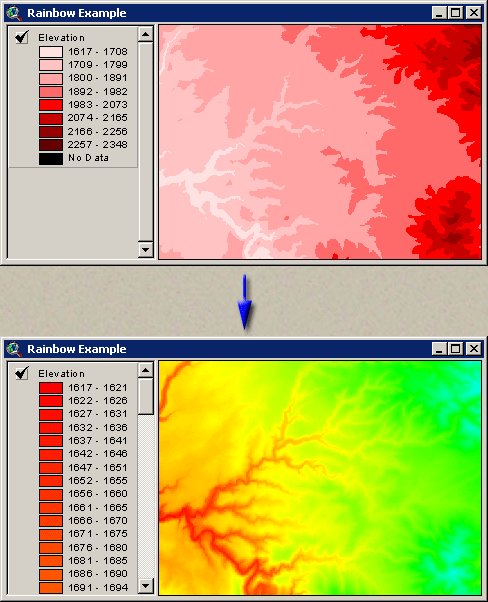
You also have the option to set your new legend visible or not. In cases where you generate large numbers of classification levels (150 in the example above), it may be useful to set your legend invisible so that it doesn’t take up the entire View table of contents area. You can also set the legend visibility in the “Theme” menu, but setting the visibility directly with this tool may be more convenient.
Finally, you can generate a graphic rainbow color ramp bar by clicking the “Make Graphic Color Bar” button. This option generates a new view, labeled something like “Color Bar” (possibly with a number after it) and will contain a single graphic object:

This
graphic can be resized by selecting it with the ![]() button
and stretching it by dragging on one of the handles:
button
and stretching it by dragging on one of the handles:

This color bar can then be added to a layout using the standard Layout functions. Remember that this color bar is actually a View document, so you add it to your layout as you would any other view. Alternatively, you could copy and paste this graphic directly into your view. If so, you will almost certainly need to reposition and resize the graphic. The original graphic coordinates extend from (0, 0) to (500, 20).
You can also take a screenshot of the color bar to paste it into graphic-editing software (i.e. Photoshop, Photopaint, etc.). Click [Alt]-Print Screen to copy the image to the clipboard, then [Control]-V to paste the image into your graphics software.
![]()
Custom Color Ramps:
This tool is intended to generate grid legends that ramp (or blend) between multiple colors, and to give you the ability to set the colors and ramp anchor points. IMPORTANT: This tool is not designed to do any type of classification analysis. It only ramps colors smoothly between anchor points.

Click the “Build Custom Color Ramp…” menu item to start the process. You will first be asked to identify the grid theme you wish to build a custom legend for:

Select your grid and click ‘OK’ to open the “Build Color Ramp” window:

The vertical slider on the right of the window shows how the colors will be ramped, and the number box at the top of the window shows how many total color levels to include in the ramp. The color boxes on the right side of the slider show the color anchors, and the numbers on the left side of the slider show the values associated with those colors. In this case, the tool will generate a legend with 24 shades of gray, ranging from White at Value=1617 to Black at 2348.
Adding, Deleting and Changing Color Anchors:
You can add a midpoint color anchor by dragging the slider to the appropriate point and choosing a color. For example, to ramp from White to Red to Black, you would drag the slider to the appropriate point and enter a Red color. As soon as you move the slider, the Color Palette window and a “Select Color” window will open:

Select the desired color and click ‘OK’ to add your new color anchor:

Apply, OK and Cancel: You can test your new color ramp by clicking the ‘Apply’ button. This will apply the new color ramp to your theme while leaving the window open. Clicking the ‘OK’ button will apply the color ramp and close the window. The ‘Cancel’ button will close the dialog and reset the theme legend to the original condition.
Changing or Deleting Anchor Colors: You can change the colors of any of the anchor points, or delete any of the internal anchor points, by clicking on the color box. You will be prompted to either delete that color anchor or to change the color:

You cannot delete either of the end anchor points.
Clear: At any point you can clear and reset your custom ramp by clicking the ‘Clear’ button. This button clears all internal color anchors and resets the endpoints to White and Black. It does not change the current number of ramped colors.
Invert: The ‘Invert’ button reverses the order of the colors.
Refresh: The “Refresh” button redraws the slider and the color anchors. The window is resizable by dragging on a corner, but unfortunately the slider does not change size with the window. If you change the size of the window, you must click the ‘Refresh’ button to redraw everything.
Loading Pre-Defined Color Schemes:
ArcView includes a number of pre-defined color schemes that are available in the Legend Editor (i.e. “Red Monochromatic”, “Elevation #1”, “Autumn Leaves”, etc.). This custom color ramp tool also gives you access to these color schemes, plus gives you the ability to ramp between all colors. Choose a scheme from the drop-down list and confirm that you wish to apply it:

Loading and Saving Custom Color Schemes:
This tool provides a way to save custom color ramps so they can be used with other themes. This tool does not save ArcView legends (*.avl) files like the Legend Editor does, but rather specialized files intended to be used specifically with this tool.
IMPORTANT: The saved color ramps do not reference the actual values of the data. If you build and save a custom ramp on a theme that ranges from a value of 1000 to 2000, then you will still be able to apply it to a theme that ranges from 100 to 200. The color anchor points are saved in terms of the percentage along the range of the data rather than in terms of specific data values.
Making Graphic Color Bars:
The “Make Graphic Color Bar” button will generate two graphic color bars that illustrate your color ramp, and which can be used to help make more attractive legends for your grid themes. For example, this tool was used to generate color bars for the author’s Mahalanobis Distances extension manual (see two illustrations at:
http://www.jennessent.com/arcview/mahalanobis_description.htm
In the case of the vertical color bars, the author took screen shots of the color bars, pasted them into image-editing software and rotated them (see discussion of Rainbow color bars above for instructions).
The button makes two color bars. The top one shows only the colors that are actually used in the legends (40 in the example below), while the bottom color bar smoothly blends between colors.
These
color bars are actually in View documents, so they can be added to layouts
using the “Add View Frame” function. The color bars can also be copied
from the Color Bar window and pasted directly into your views, in which
case they will likely need to be resized and repositioned in order to look
aesthetically correct. They can be resized and repositioned the same way
any other graphic shape is, by selecting it with the ![]() button
and then moving the shape or dragging one of the handles.
button
and then moving the shape or dragging one of the handles.

Creating General Graphic Color Bars:
This extension can create graphic color bars (similar to that pictured above) for any grid or feature theme in your view, based on the current legend you have set for that theme.
This function will automatically work on all active grid or feature themes in your view, so begin by clicking on those themes to make them active. Next, simply click the “Color Bar from Legend” menu item in the “Theme” menu and specify whether you want the color bars to be vertical or horizontal.
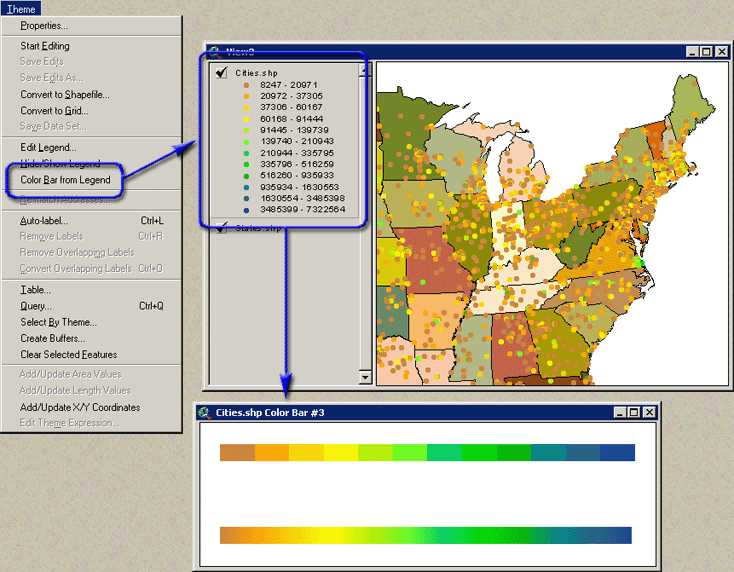
The function makes two color bars; one of which shows only the colors that are actually used in the legends (12 in the example above), while the other smoothly blends between colors.
These color bars are actually in View documents, so they can be added to layouts using the “Add View Frame” function. The color bars can also be copied from the Color Bar window and pasted directly into your views, in which case they will likely need to be resized and repositioned in order to look aesthetically correct. They can be resized and repositioned in the same manner as any other graphic shape by selecting it with the button and then moving the shape or dragging one of the handles.
![]()
Grid Tools Main Page | Grid Statistics and Standardization | Clipping and Combining Grids