
![]()
Neighborhood Statistics | Descriptive Statistics | Standardize Grids
![]()
This option generates a new grid representing neighborhood statistics from an existing grid. Each cell value in the new grid represents some statistic (i.e. mean, min, max, standard deviation, etc.) from some region of cells surrounding the original cell in the original grid, where the region is called a Neighborhood and can come in a variety of shapes and sizes. The standard Spatial Analyst Neighborhood Statistics function includes options for rectangles, circles, wedges and doughnuts (see ArcView Help files for more information; especially “FocalStats Discussion”). The Neighborhood Statistics function included with this extension is very similar to the original Spatial Analyst function except that this tool allows you to generate custom-shaped neighborhoods and also generate multiple sets of statistics with one operation.
Click the “Neighborhood Statistics” menu item to start the process. You will be asked to identify the grid theme you wish to analyze and the statistics you wish to generate. You may select multiple statistics. This window is resizable by dragging on a corner.
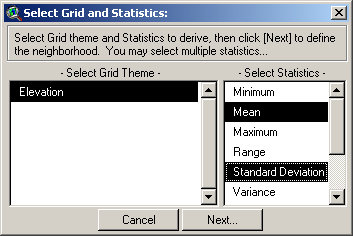
Statistic Options:
If your Grid Theme is a Floating Point theme (i.e. with decimal numbers, and therefore without an attribute table), then your statistics options will include:
1. Minimum: Each cell value in the new grid will reflect the lowest value in the neighborhood around the original cell.
2. Mean: Each cell value in the new grid will reflect the average value in the neighborhood.
3. Maximum: Each cell value in the new grid will reflect the maximum value in the neighborhood.
4. Range: Each cell value in the new grid will reflect the range of values (i.e. the maximum – the minimum) in the neighborhood.
5. Standard Deviation: Each cell value in the new grid will reflect the standard deviation of values in the neighborhood.
6. Variance: Each cell value in the new grid will reflect the variance of values in the neighborhood.
7. Sum: Each cell value in the new grid will reflect the sum of values in the neighborhood.
If your Grid Theme is an Integer theme, you have a few more options:
a) Majority: Each cell value in the new grid will reflect the value that occurs most often in the neighborhood.
b) Minority: Each cell value in the new grid will reflect the value that occurs least often in the neighborhood.
c) Median: Each cell value in the new grid will reflect the median value in the neighborhood.
d) Variety: Each cell value in the new grid will reflect the number of unique values in the neighborhood.
Neighborhood Options:
You will next be asked to define your neighborhood. You can choose between a circle, annulus (doughnut-shape), rectangle, wedge, or custom shape. You can also enter your neighborhood parameters in units of either grid cells or map units (i.e. meters, feet, etc.).
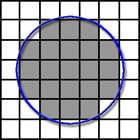
| Circle: A circular neighborhood defined by a radius length extending outward from the cell center. In theory, this neighborhood should be composed of all grid cells whose cell centers lie within that distance of the focal cell center, but Spatial Analyst appears to have some kind of number rounding issue that sometimes includes or excludes cells that do not exactly fit this definition. If possible, test the neighborhood function to make sure it is including the all the cells you need it to. If not, you may be able to use the Custom Neighborhood function to create a correct neighborhood. |
 |
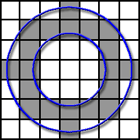
| Annulus: An annular neighborhood looks like a ring or doughnut defined by an inner and outer radius length extending outward from the cell center. This neighborhood should be composed of all cells whose cell centers lie within this ring, but this can also be affected by the rounding issues that affect the Circular neighborhood. If testing reveals that the annular neighborhood is not working exactly as desired, you may be able to generate a custom neighborhood that will work correctly. |
 |
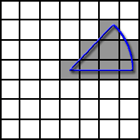
| Wedge: A wedge-shaped neighborhood looks like a slice of pie cut out of a circular neighborhood and is defined by a starting angle, and ending angle, and a radius. As always, it is advisable to test and confirm that your neighborhood is correct, and possibly generate a custom neighborhood if necessary. |
 |
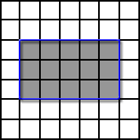
| Rectangle: A square or rectangular neighborhood defined by width and height, which will be centered around your focal cell center. Cells will be included in the neighborhood if the cell centers lie within this rectangle. |
 |
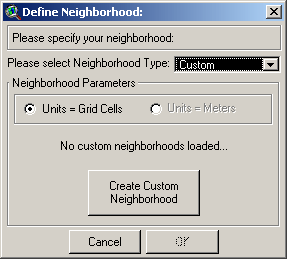
| Custom: Custom neighborhoods can be of any shape or arrangement and are defined by explicitly stating which cells, relative to the focal cell, will be included in the neighborhood. To generate a custom neighborhood, first select the “Custom” option from the drop-down list of Neighborhood Types: | |
Next click the “Create Custom Neighborhood” button to open the custom neighborhood definition window. Select your general neighborhood size by moving the slider to the correct value, and then click in the boxes to specify which cells you wish to be included in the analysis:
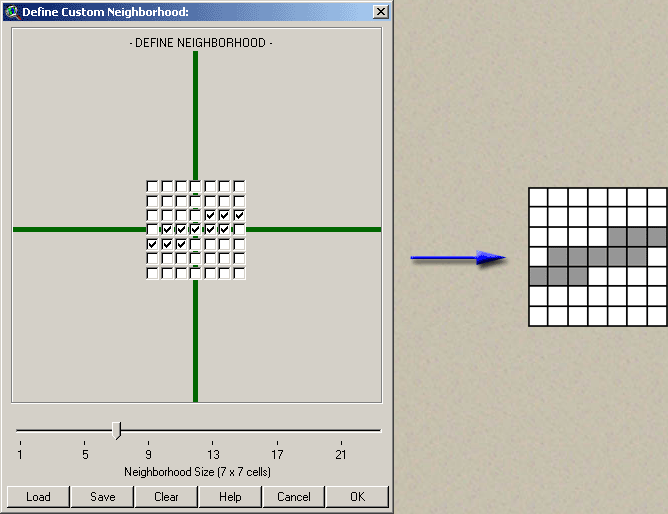
Click OK to go back to the “Define Neighborhood” window and notice that it now says “Custom 7 x 7 Neighborhood Loaded…”.
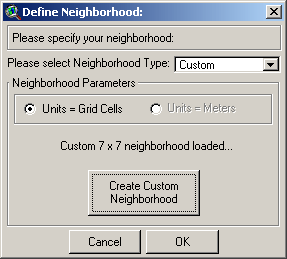
You can now click ‘OK’ and generate your neighborhood statistics grid(s).
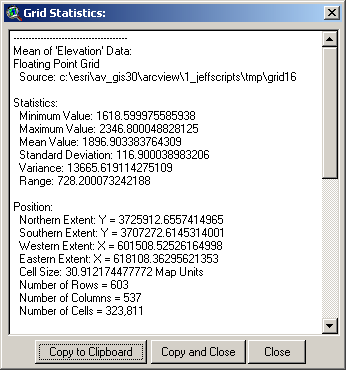
This function produces a report detailing some general statistics for grid themes, including the minimum, maximum, mean, standard deviation, variance and range for all grid cell values in the grid. The report also describes the geographic extent, the number of rows, columns and cells, and the hard drive location of the grid.
Select the “Grid Descriptive Statistics” menu item and then select the grids you would like to describe:
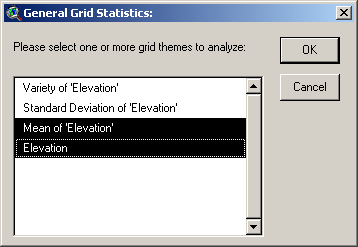
Click ‘OK’ and you will see a report window with the grid description:
In this case, to standardize a grid means to transform the grid cell values such that the grid has a mean = 0 and a standard deviation = 1. This may be useful in some analyses where the grids may have widely different numeric scales. For example, Andrew Weiss, in a discussion of Topographic Position Indices, describes how it may be desirable to standardize TPI grids before using them for landform identification. This process is described in a poster presented at the 2001 ESRI User Conference.
Technically, all that happens in this operation is that the original grid is subtracted from the grid mean, then divided by grid standard deviation:
![]()
![]()
Grid Tools Main Page | Custom Color Ramps for Legends | Clipping and Combining Grids