

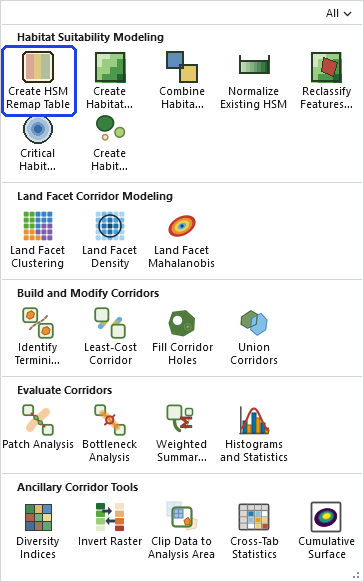
Create HSM Remap Table
Summary
One of the first steps in modeling habitat for the Corridor Designer tools. This window allows you to take a species expert's suitability scores for different habitat variables — the translation from each factor's raw values to the 0–100 scale — and save them as remap tables that Create Habitat Suitability Model reads. It replaces the original CorridorDesigner workflow of hand-editing tab-delimited text files: pick the factor raster, and the window builds the scoring grid for you — each class value for a categorical raster, from–to ranges for a continuous one — ready for scores straight off the expert's spreadsheet.
What it writes
A remap table: one row per class or range of the factor raster, giving the raw value (or the low and high ends of a range) and the suitability score it maps to. That table is what Create Habitat Suitability Model reads to turn a land-cover, elevation, topographic-position or distance raster into a 0–100 suitability layer. Scores follow the CorridorDesigner biological anchors (100 best … 0 absolute non-habitat; see the scale discussion on the Create HSM page), and the window keeps continuous ranges contiguous so no raster value falls through a gap.
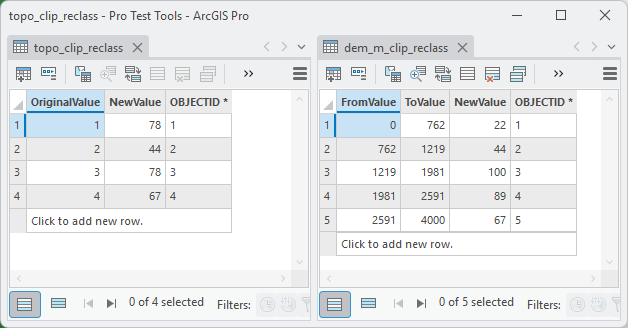
The format is a secondary matter and follows the destination: a geodatabase gets a remap table (FromValue / ToValue / NewValue), a folder gets an ASCII remap file in the original CorridorDesigner format, so legacy species files and new geodatabase projects live side by side, and either kind feeds the HSM tool.
A tour of the window
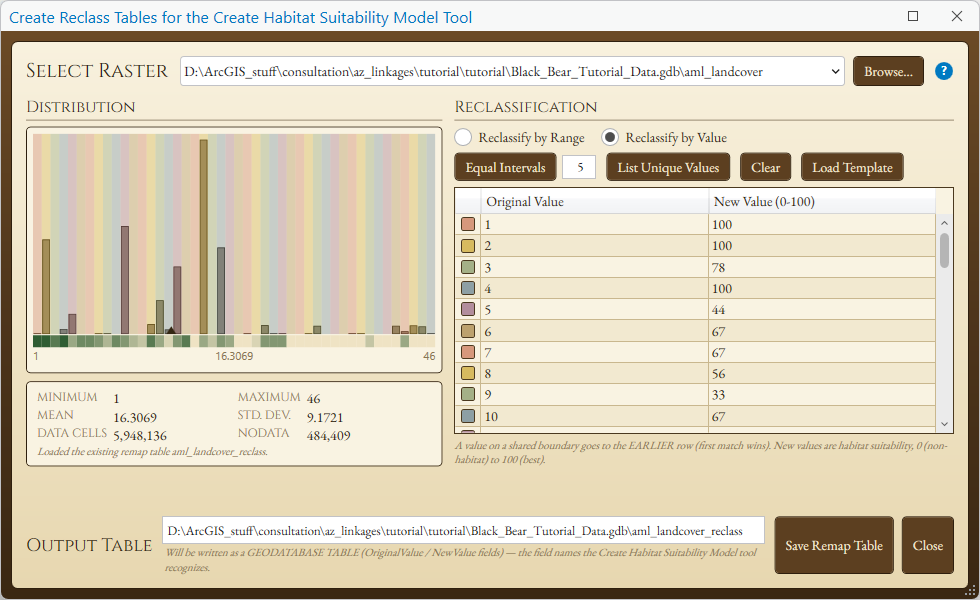
The window scores one raster at a time. Pick the raster, look at how its values are distributed, decide whether to score it class by class or range by range, fill in the scores, and save the table. The example is the black bear land cover from the Corridor Design Tutorial, a categorical raster of 46 vegetation classes scored by value.
The controls
- Select Raster lists the single-band raster layers in the active map; Browse... reaches any raster on disk or in a geodatabase instead. The blue ? opens this page.
- Distribution draws the raster's values: one bar per value when the raster has few distinct values, a binned histogram with a smoothed density curve when it is continuous. Translucent washes over the histogram show which input values the remap rows cover so far, tinted by the score they map to, so gaps and overlaps are visible before you save. The box beneath gives the minimum, maximum, mean, standard deviation, the number of data cells and the number of NoData cells, and notes when an existing remap table for this raster was found and loaded.
- Reclassify by Range and Reclassify by Value set the shape of the table. By value, each row is one exact input value and its score: the mode for categorical rasters such as land cover or topographic position. By range, each row is a From–To span and its score: the mode for continuous rasters such as elevation or distance from roads.
- Equal Intervals replaces the rows with equally wide From–To ranges from the raster's minimum to its maximum, as many as the count in the box, with the scores left blank for you to fill in.
- List Unique Values switches to by-value scoring and lists every distinct value in the raster, one row each, again with blank scores. It is enabled for integer rasters with a modest number of distinct values.
- Clear empties the grid.
- Load Template fills the grid from an existing remap table or ASCII remap file, typically one made earlier for a similar raster or supplied by a species expert, such as the species text files in the tutorial data. Adjust any row you disagree with, then save under this raster's own output name.
- The grid is where the scores go: type a New Value from 0 (non-habitat) to 100 (best) in each row, and add or remove rows as needed. A value that falls on a boundary shared by two ranges goes to the earlier row; the first match wins.
- Output Table is the path the table will be written to. It defaults to a name beside the source raster, and the note beneath it says which format that path will produce.
- Save Remap Table writes the table; Close dismisses the window.
Continuous rasters
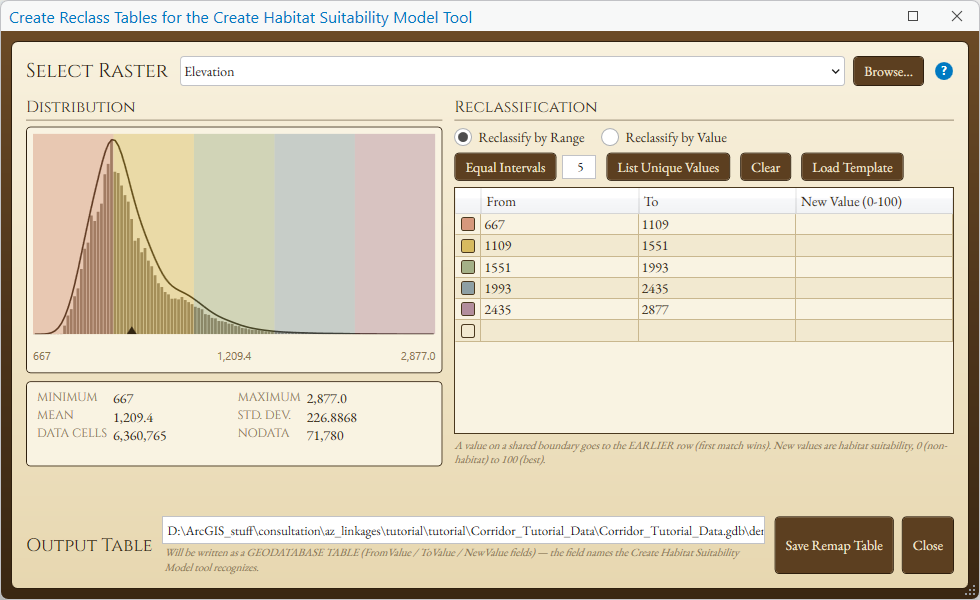
A continuous raster such as elevation is scored by range, and the window changes with it. The histogram becomes a binned distribution with a smoothed density curve, and the grid gains a third column: every row has a From value, a To value and the New Value that all cells in that span receive. Clicking Equal Intervals with 5 in the box splits the 667 to 2,877 m range of this DEM into five equal spans and leaves the scores blank, as in the figure; a species expert's breakpoints rarely fall at equal intervals, so the usual next step is to edit the From and To values to the expert's own thresholds before typing the scores. The colored washes over the histogram show the five spans at once.
The saved tables
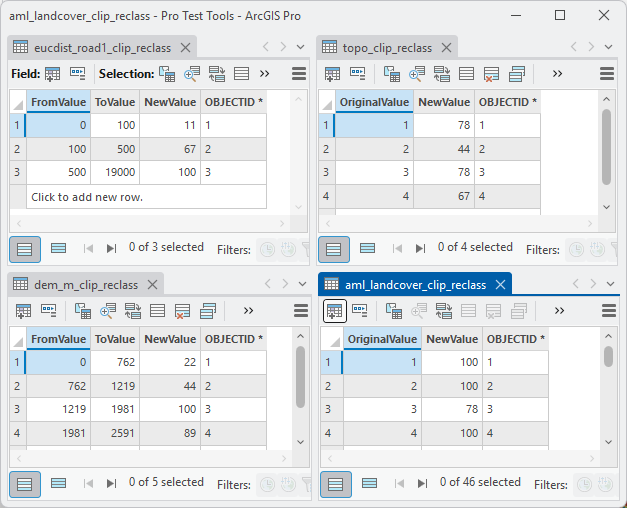
Saved into a geodatabase, a by-value table has two fields, OriginalValue and NewValue, and a by-range table three, FromValue, ToValue and NewValue. These are the field names that Create Habitat Suitability Model recognizes.
What the modeling tools require of a remap table
Create Habitat Suitability Model reads remap tables of either kind, and it is strict about their form. The rules below are the ones the original CorridorDesigner documented for its text files (the workshop book's tutorial section on the species factor reclassification files: pages 90 and 91 of the 2007 edition, pages 88 and 89 of the 2026 ArcGIS Pro edition), carried over to the geodatabase tables this window writes. This HSM Remap tool guarantees all rules are followed; they matter when you build or edit a table by hand.
Geodatabase tables.
- A by-range table must have fields named FromValue, ToValue and NewValue; a by-value table, OriginalValue and NewValue. Field names are matched without regard to case, and any other fields are ignored.
- NewValue is the suitability score, 0 to 100, with 100 the best habitat and 0 absolute non-habitat.
- A range whose To is less than its From is refused. Rows with an empty value in any of the required fields are skipped.
- Row order does not matter: the tool sorts the rows by value before it reclassifies.
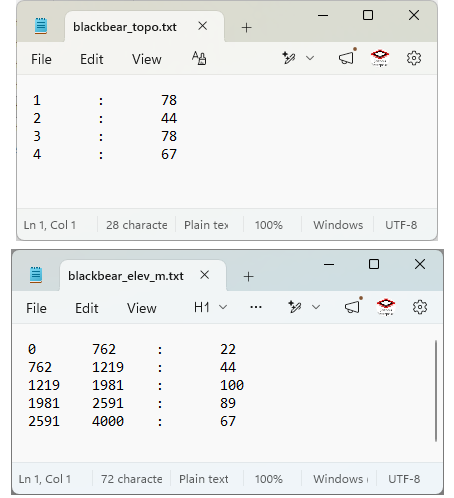
ASCII remap files, the original CorridorDesigner format, which the tool still reads unchanged, so the species files that came with the original toolkit drop straight in.
- One rule per line: a single value, a colon and its score
(
12 : 78), or a From value, a To value, a colon and the score (100 500 : 67). Values are separated by tabs or spaces. - Lines must run in ascending numerical order. The workshop book's own words: “all values must go in ascending numerical order (e.g. 1,2,3,4,5, NOT 1,3,2,5,4). The tool will fail if all values are not in ascending numerical order.” This tool checks the order and stops with a message naming the line.
- Blank lines and lines beginning with
#are ignored, so a file can carry comments.
Both kinds.
- The ranges must cover every value that occurs in the analysis area. Again from the workshop book: if there are 3,000 m mountains in the area, provide a score up to 3,000 m; if there are cells 30,000 m from a road, make the last range reach 30,000 m. A cell whose value matches no row becomes NoData in the suitability model, and the tool reports how many such cells there were.
- A value on a boundary shared by two ranges takes the score of the earlier row: the first match wins.
- One table scores one factor raster. The model tool takes one table per factor, with the factor's weight beside it.
Recommended citation
Credits and references
By Jeff Jenness, Jenness Enterprises (www.jennessent.com), for the CorridorDesigner tools by Jenness, Majka and Beier.
- Beier, P., D. Majka, and J. Jenness. 2007, revised 2026. Designing wildlife corridors with ArcGIS: ArcGIS Pro edition. Workshop book, revised by J. Jenness for the Corridor Designer Tools of the Wildlife and Forestry Tools add-in. Available at: CorridorDesigner_WorkshopBook_2026_ArcGISPro.pdf (5 MB)
- Beier, P., D. Majka, and J. Jenness. 2007. Designing wildlife corridors with ArcGIS. Workshop book, Northern Arizona University. Available at: corridordesign.org (archived copy at the Internet Archive)
Licensing information
Works at every ArcGIS Pro license level (Basic, Standard, Advanced). No extension licenses are required.
Related tools and pages
- Create Habitat Suitability Model — consumes these tables.
- Corridor Design Tutorial — Step 4 is this window, with the black bear scores.