

Generating Statistical Matrices:
This function provides a quick way to
generate tables containing the mean vector, covariance matrix, inverse
covariance matrix, Pearson’s r correlation matrix, and Spearman’s
rho rank correlation matrix from multiple fields in the current table.
The mean vector and covariance matrix tables can be used with the
Mahalanobis functions described elsewhere in this manual. Options
to generate a Pearson’s r and/or Spearman’s rho correlation
matrix are included because the author of the extension needed them for
something and decided to leave them available for others to use.
Pearson’s r correlations measure
how much one variable changes as a second variable changes, and in which
direction. Values range between -1 and 1, with negative values implying
a negative relationship (i.e. as one variable increases, the other
decreases). Values close to 1 or -1 have high correlation while values
close to 0 have low correlation. Spearman’s rho correlations are
identical to Pearson’s r except that they are calculated from the
relative rank of each value rather than the value itself (see
Conover 1980:252).
Spearman's rho correlations are generally considered more appropriate
when the variables are not normally distributed or when the researcher
wants to reduce the importance of outliers.
Open your table and click the “Create
Statistical Matrices” button
 to start the process.
You will be prompted to identify the fields to include in the analysis:
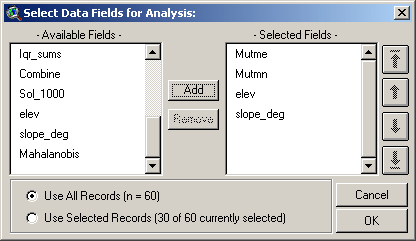
The list labeled “Available Fields”
contains all the numeric fields available in your open table and the
list labeled “Selected Fields” contains all the fields currently
selected for analysis. Select the fields you would like to analyze and
click the “Add” button to add them to the Selected list. If you need to
change the order of the selected fields for any reason, click on one of
the fields and use the arrow buttons on the left to shuffle it up or
down. If any of your records are selected, you have the option to
analyze either the full set of records or only the selected set.
Next, choose which matrices you would
like to generate:
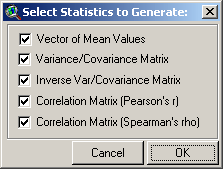
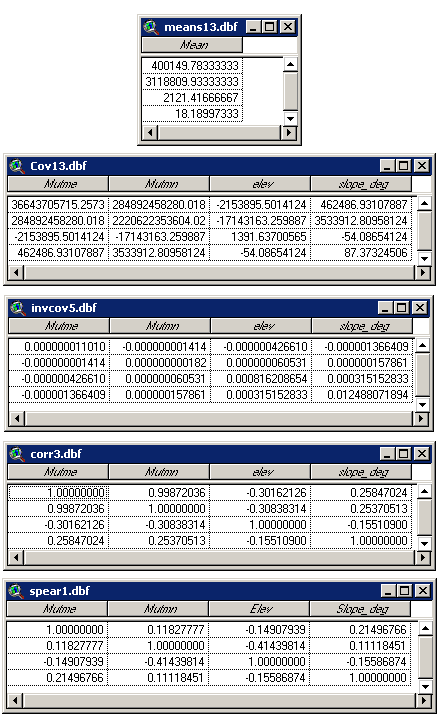
Click ‘OK’ and the tables will be
generated and opened, along with a Report dialog describing the
analysis. See the description of the
Report window for
more details on the report components.
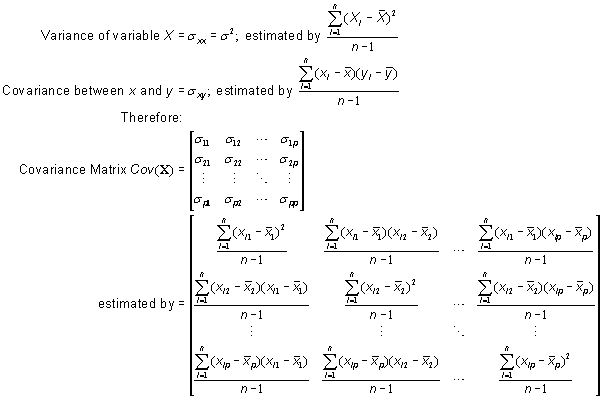
Statistical Matrix Methods:
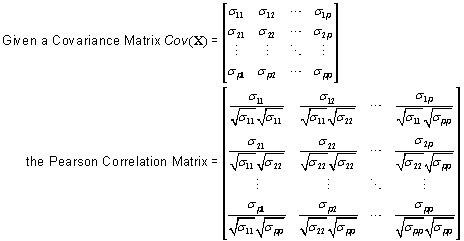
![]()
![]()


