|
|
|||||
|
|
Generating Mahalanobis Distances for Feature Themes: This process does not generate a Mahalanobis surface grid, nor does it use any predictor variable grids in the analysis. Rather, it generates individual Mahalanobis distances for each feature in a feature theme based on attribute data contained in the feature attribute table. The output is presented in a Results table containing ID values for each feature and the Mahalanobis distance of that feature, and the table can easily be joined to the feature attribute table for further analysis. If you wish to add a field with Mahalanobis distances
directly to the attribute table, open the table using the
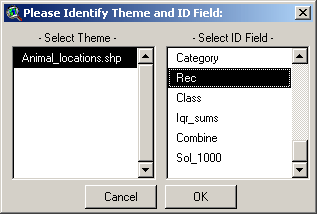
Click the “Theme Mahalanobis Distances” button
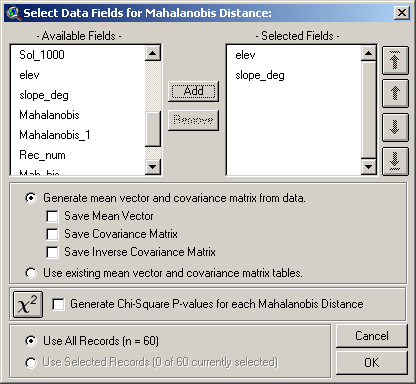
Next, identify the fields containing the independent variable values for each record, and specify whether you would like to generate the mean vector and covariance matrix directly from the data or use existing mean vector and covariance matrix tables:
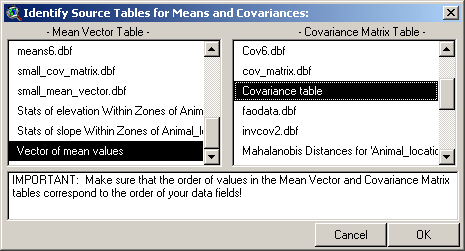
The “Available Fields” list on the left contains all the numeric fields available in the theme attribute table, and the “Selected Fields” list on the right contains all the fields to be used in the analysis. Select one or more fields from the “Available” list and click the “Add” button to add them to the “Selected” list. If you need to reorder the selected fields (if, for example, you need to generate a mean vector or covariance matrix in a particular order, or if you need to reorder your fields to match an existing mean vector or covariance matrix), use the arrow buttons on the left to shuffle the fields up or down. You have the option to generate your mean vector and covariance matrix directly from the data, in which case the Mahalanobis distances will reflect the distance of each individual feature from the internal mean vector of the group. Such values may be useful for determining within-group variability. Alternatively you can generate distances of each record from some other mean vector, possibly generated from a control group or based on earlier research, by clicking the “Use existing mean vector and covariance matrix tables” option. See Knick and Dyer (1997) for an example of substituting a weighted mean and covariance matrix when certain input variables are better measured than others. If you choose this second option, you will next be asked to identify the tables containing your Mean vector and Covariance matrix:
This window is resizable by dragging on a corner. Recall that using existing tables requires that your input fields be correctly ordered. In our previous example, we don’t want our Elevation values to be evaluated based on our Slope mean and variance! Use the arrow buttons on the previous window to adjust your field order. If any of your features are currently selected, you will have the option to use either all features in the analysis or only the selected features. You also have the option to generate
p-values for each Mahalanobis value, based on a Chi-square distribution
with n-1 degrees of freedom. See the discussion of
Chi-square p-values
for a description of the relationship between Chi-square p-values and
Mahalanobis values. The
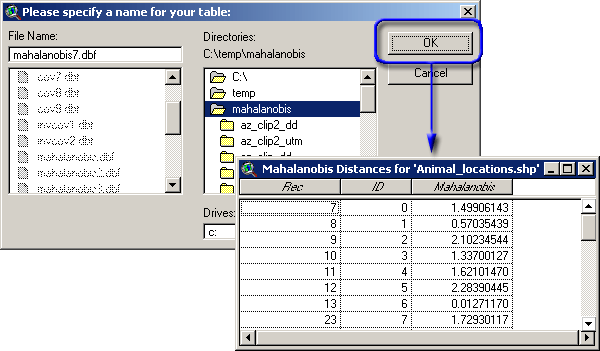
Click ‘OK’ to generate the Results table of Mahalanobis distances. You will be asked where you want to save your table, and the table will then be generated and opened. If you elected to generate additional tables, these tables will open also.
If you wish, you can join this new table with your original attribute table with the following steps:
You will also see a report describing several aspects of the analysis which may be of interest, including the hard drive location of any new tables and a check on the matrix inversion calculations (see explanation of the Report window in “Generating Mahalanobis Distance Surface Grids” for more details).
Mahalanobis Intro | Mahalanobis Description | Generating Mahalanobis Grids | Mahalanobis Chi-Square Tools | Mahalanobis Distances for Tables | Additional Mahalanobis Matrices | Mahalanobis References Download Extension | Download Manual
Jenness Enterprises | ArcView Extensions | GIS Consultation | Unit Converter |
||||
