|
|
|||||
|
|
|
||||
| Generating P-value grid from Mahalanobis Distance Grid: | |
| Calculating P-values for individual Mahalanobis Distance Grid cells: |
![]()
Generating P-value grid from Mahalanobis Distance Grid:
When the predictor variables used to generate the mean vector and covariance matrix are normally distributed, then Mahalanobis distances are distributed approximately according to a Chi-square distribution with n-1 degrees of freedom. In such cases it may be useful to convert the Mahalanobis distance grid into a grid of p-values. If the predictor variables are not normally distributed, it may still be useful to make this conversion because it rescales the unbounded Mahalanobis values such that they are all between 0 and 1. For more details on the uses of converting to p-values, see the discussion on Chi-Square values or refer to Clark et al. 1993.
The button provides an easy way to convert Mahalanobis
grids into p-value grids. Click the
![]() button and you
will be prompted to identify your Mahalanobis grid and the appropriate
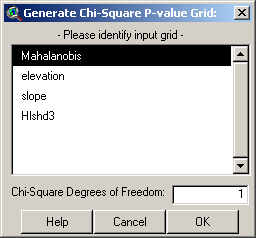
degrees of freedom:
button and you
will be prompted to identify your Mahalanobis grid and the appropriate
degrees of freedom:

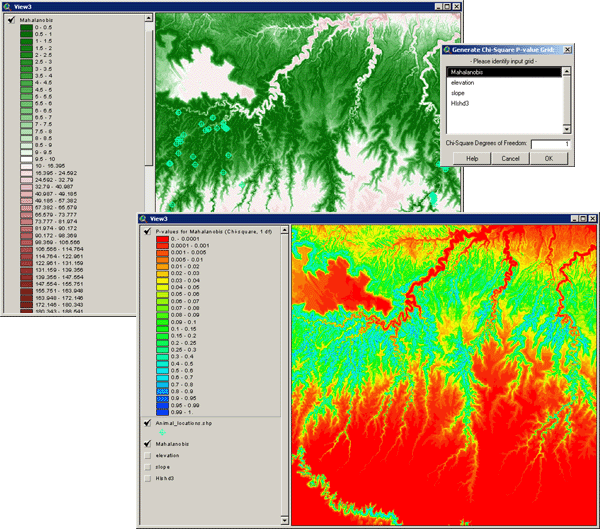
The degrees of freedom should be equal to n-1, where n = # predictor variables used to generate the original mean vector and covariance matrix. The Mahalanobis grid in this example was generated from 2 predictor variables (Slope and Elevation), so there would only be 1 degree of freedom. Click the OK button to generate the p-value grid:

Due to a limitation in Spatial Analyst, this function does not generate exact p-values for each cell but rather classifies the grid into 26 p-value ranges. The p-value for each cell reflects the probability of seeing a Mahalanobis value as large or larger than the actual Mahalanobis value for that cell, assuming the vector of predictor values that produced that Mahalanobis value was sampled from a population with an ideal mean (i.e. equal to the vector of mean predictor variable values used to generate the original Mahalanobis grid). P-values close to 0 reflect high Mahalanobis distance values and are therefore very dissimilar to the ideal combination of predictor variables. P-values close to 1 reflect low Mahalanobis distances and are therefore very similar to the ideal combination of predictor variables.
Calculating P-values for individual Mahalanobis Distance Grid cells:
The
![]() tool allows you to
calculate exact p-values for individual Mahalanobis surface grid cells,
assuming a Chi-square distribution with n-1 degrees of freedom where n =
# predictor variables used to generate the mean vector and covariance
matrix. See the discussion of
Chi-Square values
for an explanation of this concept.
tool allows you to
calculate exact p-values for individual Mahalanobis surface grid cells,
assuming a Chi-square distribution with n-1 degrees of freedom where n =
# predictor variables used to generate the mean vector and covariance
matrix. See the discussion of
Chi-Square values
for an explanation of this concept.
When you initially click the
![]() tool, you will be
asked to identify the degrees of freedom to use in the calculations:
tool, you will be
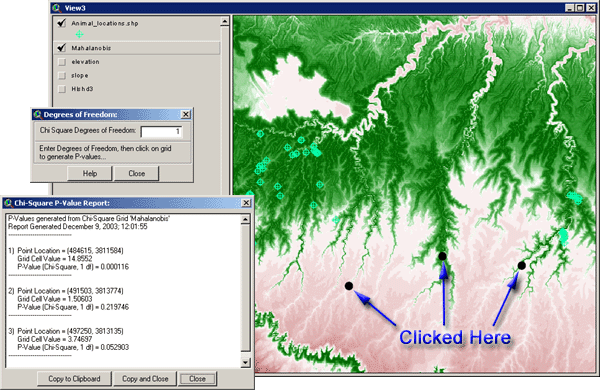
asked to identify the degrees of freedom to use in the calculations:

After you enter a number, you can start
clicking on the screen to calculate p-values. Your cursor should be
represented with a
![]() symbol. As you click on different places on the grid, you will generate
a running list of p-values:
symbol. As you click on different places on the grid, you will generate
a running list of p-values:

![]()
Mahalanobis Intro | Mahalanobis Description | Generating Mahalanobis Grids | Mahalanobis Distances for Feature Themes | Mahalanobis Distances for Tables | Additional Mahalanobis Matrices | Mahalanobis References
Download Extension | Download Manual
![]()
Jenness Enterprises | ArcView Extensions | GIS Consultation | Unit Converter


